Fig. 16
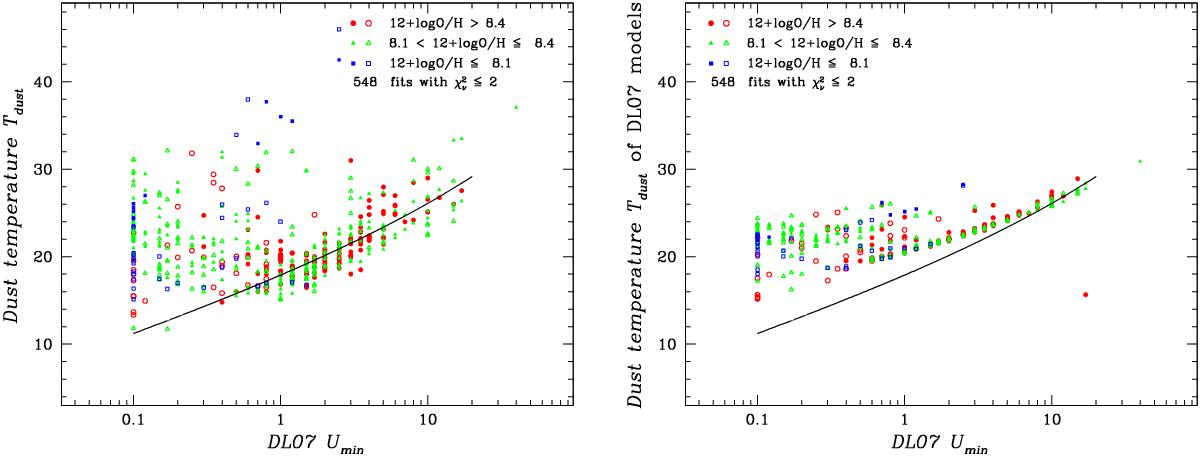
Best-fit MBBV data dust temperature Tdust (in the left panel) and best-fit MBBV DL07 Tdust (in the right) plotted against Umin. Only those MBBV DL07 fits with ![]() ≤ 2 are considered in the plot. As before, points are coded by oxygen abundance. The curves in both panels are
≤ 2 are considered in the plot. As before, points are coded by oxygen abundance. The curves in both panels are ![]() assuming the relation between βDL07 and Umin (see text and Fig. 15).
assuming the relation between βDL07 and Umin (see text and Fig. 15).
Current usage metrics show cumulative count of Article Views (full-text article views including HTML views, PDF and ePub downloads, according to the available data) and Abstracts Views on Vision4Press platform.
Data correspond to usage on the plateform after 2015. The current usage metrics is available 48-96 hours after online publication and is updated daily on week days.
Initial download of the metrics may take a while.