Fig. 12
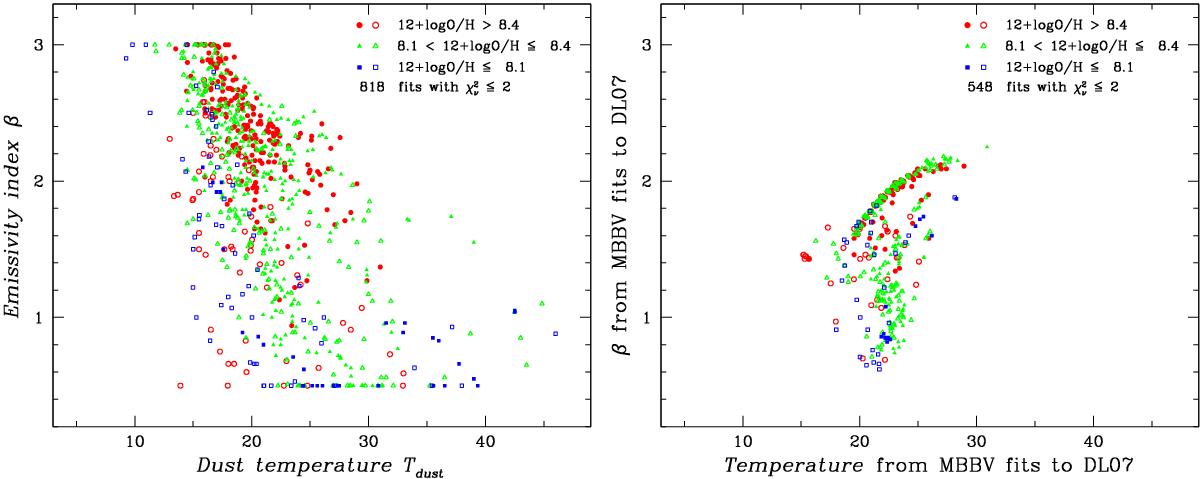
Fitted MBBV emissivity index β plotted against fitted dust temperature Tdust. The left panel shows the MBBV fits to the data, and the right the MBBV fits to the best-fit DL07 models. Data are distinguished by O/H with (red) circles showing 12 + log (O/H)>8.4, (green) triangles 8.0 <12 + log (O/H)≤ 8.4, and (blue) squares 12 + log (O/H)≤ 8.1. Filled symbols correspond to positions with normalized (to optical radius Ropt) radii within R/Ropt≤ 0.8, and open symbols to larger radii.
Current usage metrics show cumulative count of Article Views (full-text article views including HTML views, PDF and ePub downloads, according to the available data) and Abstracts Views on Vision4Press platform.
Data correspond to usage on the plateform after 2015. The current usage metrics is available 48-96 hours after online publication and is updated daily on week days.
Initial download of the metrics may take a while.