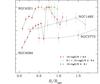
Fig. 10
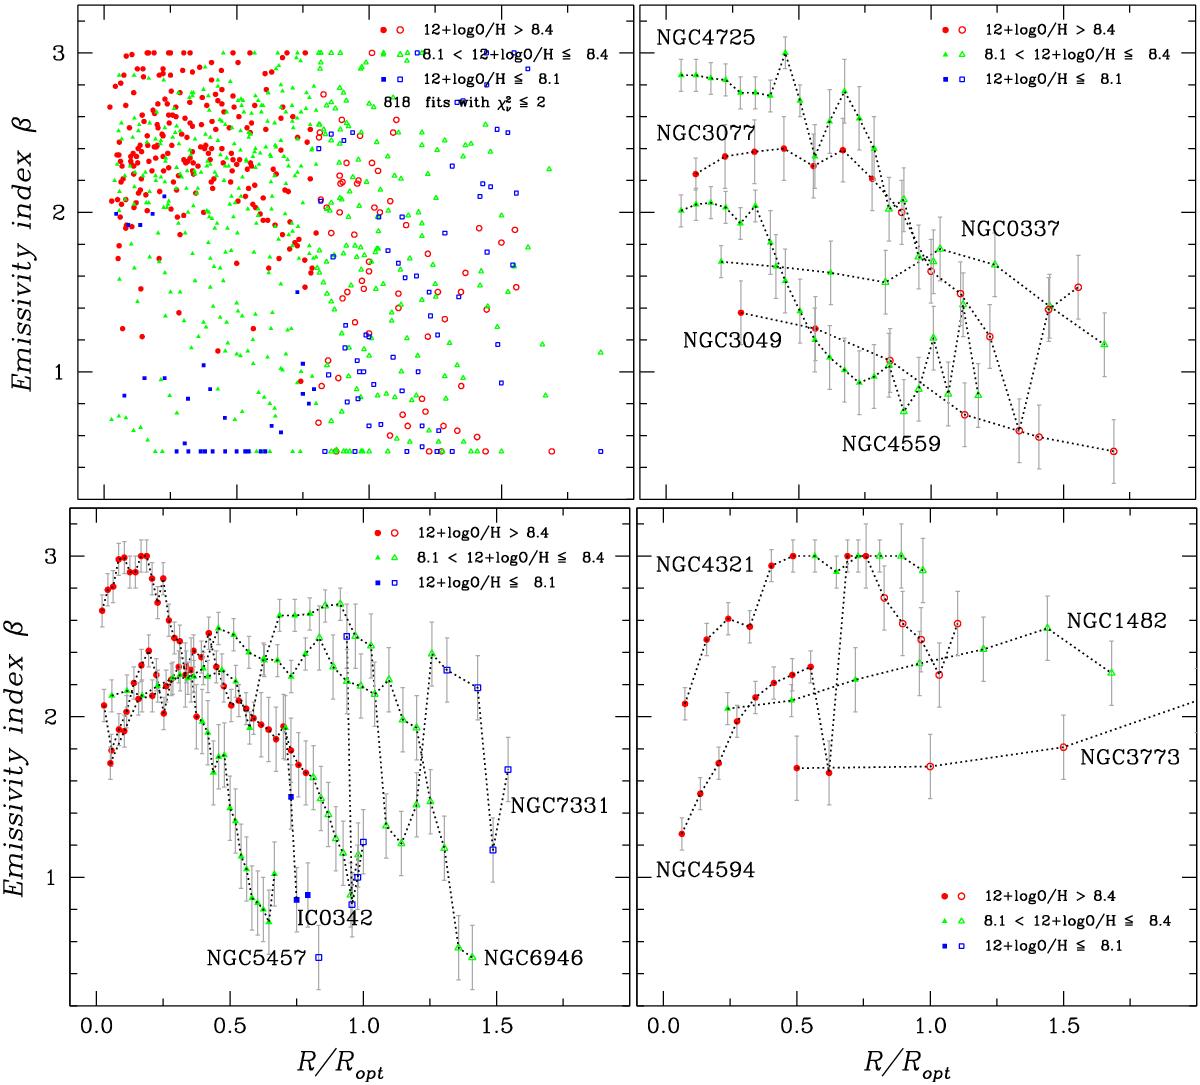
Emissivity index β gradients with galactocentric distance R/Ropt. The upper-left panel shows all galaxies together, while individual galaxies are shown in the remaining panels. The upper-right panel illustrates examples of negative radial gradients, the lower-left rising then falling, and the lower-right panel positive radial gradients. In all panels, as in Fig. 8, points are coded by their oxygen abundance, with filled symbols corresponding to R/Ropt≤ 0.8 and open ones to larger radii.
Current usage metrics show cumulative count of Article Views (full-text article views including HTML views, PDF and ePub downloads, according to the available data) and Abstracts Views on Vision4Press platform.
Data correspond to usage on the plateform after 2015. The current usage metrics is available 48-96 hours after online publication and is updated daily on week days.
Initial download of the metrics may take a while.