Free Access
Fig. 9
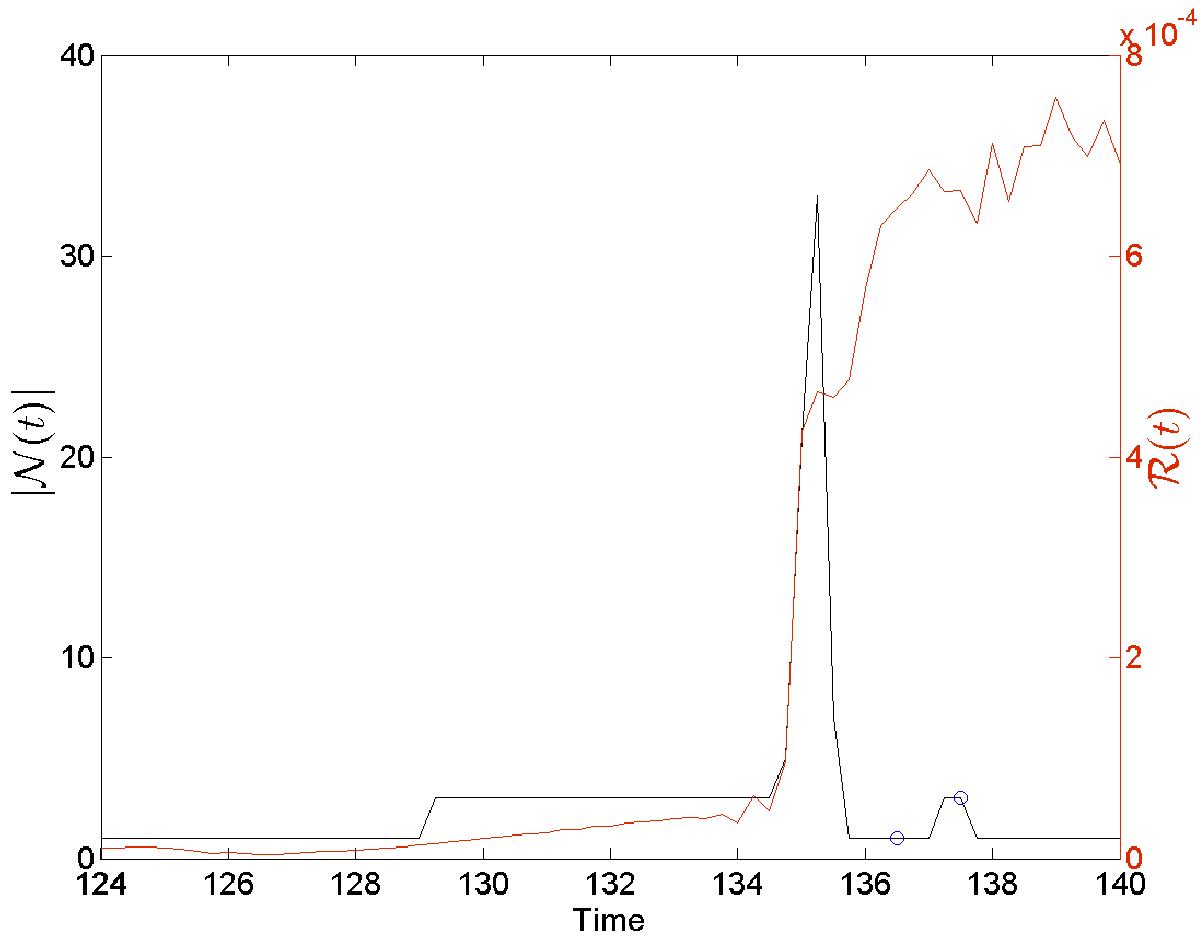
Time series for ![]() (black) and ℛ(t) (red). Blue circles correspond to the connectivity maps (a) and (b) from Fig. 8. The y = 0 plane has been used as the initial location to trace field lines for the calculation of ℛ(t).
(black) and ℛ(t) (red). Blue circles correspond to the connectivity maps (a) and (b) from Fig. 8. The y = 0 plane has been used as the initial location to trace field lines for the calculation of ℛ(t).
Current usage metrics show cumulative count of Article Views (full-text article views including HTML views, PDF and ePub downloads, according to the available data) and Abstracts Views on Vision4Press platform.
Data correspond to usage on the plateform after 2015. The current usage metrics is available 48-96 hours after online publication and is updated daily on week days.
Initial download of the metrics may take a while.