Fig. 7
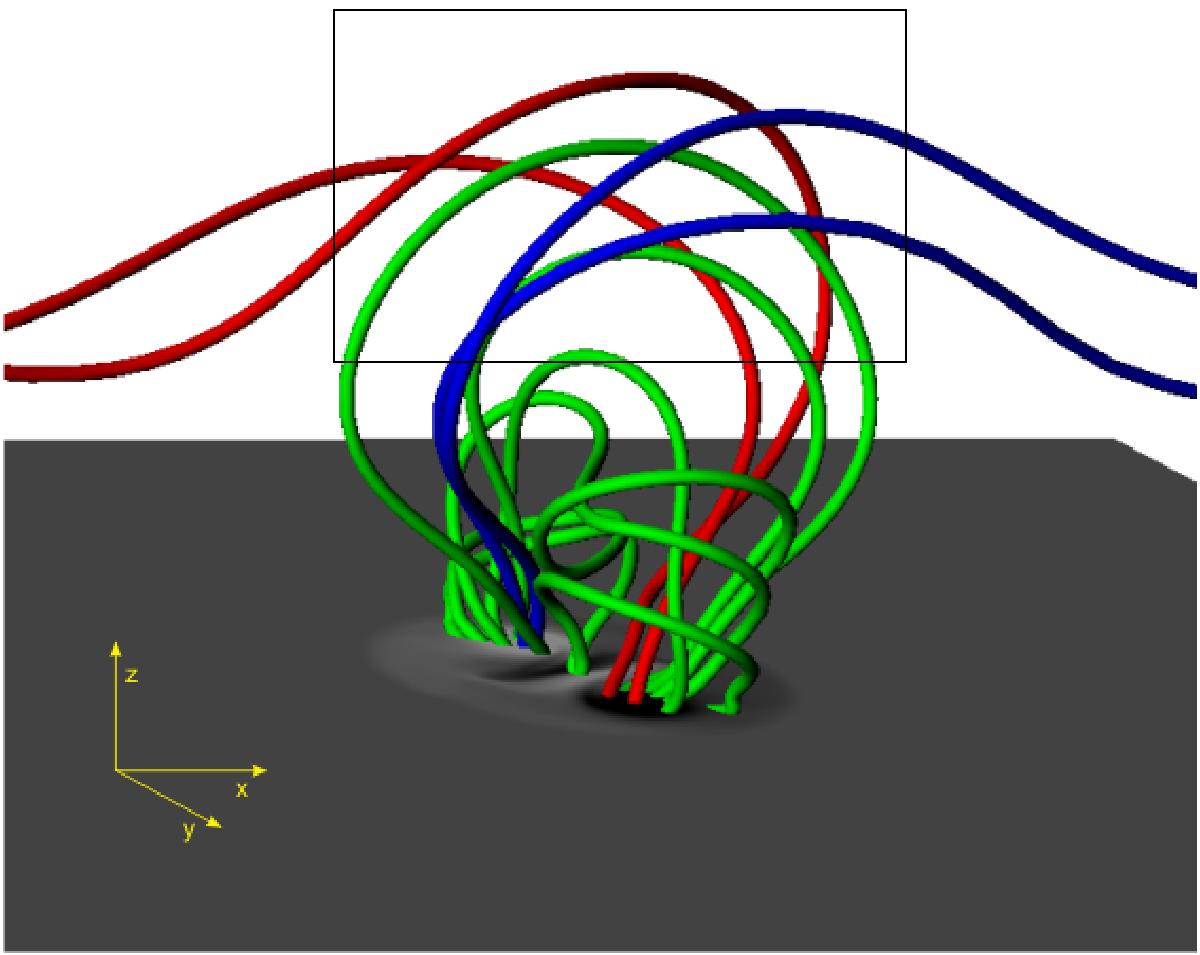
Overlying reconnection at t = 137. The colour scheme is as before. Reconnection no longer takes place at a single point but at several throughout the current sheet, as indicated by the box that covers the whole of the top of the EFR. A map of Bz is displayed at the base of the photosphere (z = 0). The reconnected field lines now connect inside the footpoints rather than at the edges. The ambient field has been omitted for clarity.
Current usage metrics show cumulative count of Article Views (full-text article views including HTML views, PDF and ePub downloads, according to the available data) and Abstracts Views on Vision4Press platform.
Data correspond to usage on the plateform after 2015. The current usage metrics is available 48-96 hours after online publication and is updated daily on week days.
Initial download of the metrics may take a while.