Fig. 4
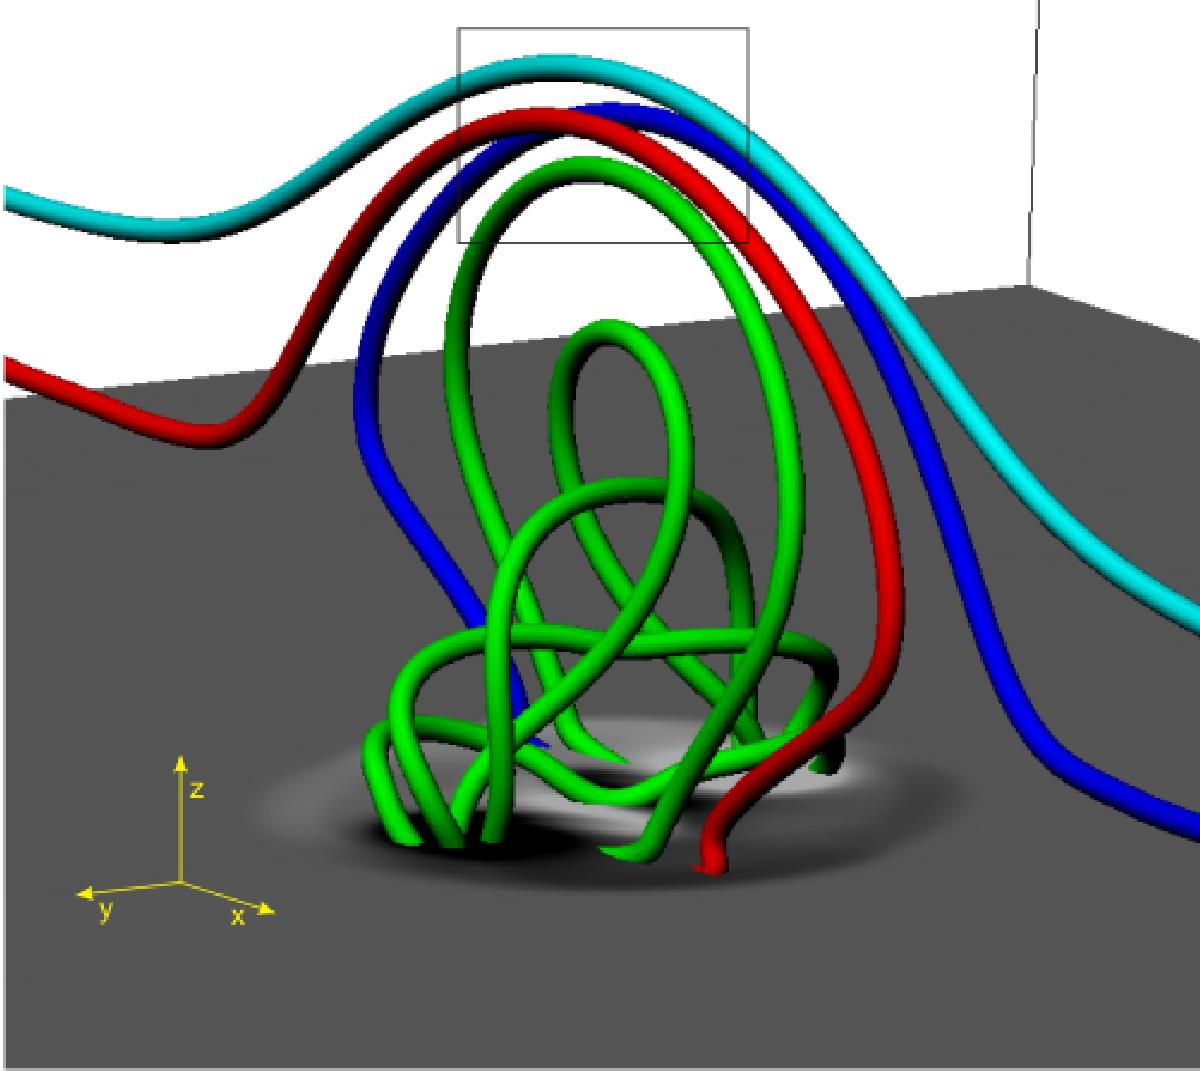
Overlying reconnection at t = 110. The colour scheme is as before. Reconnection occurs between the top of the (green) EFR and the (cyan) overlying field, within the displayed box. Reconnected (red and blue) field lines allow surges to flow from the corona (top of the EFR) down to the chromosphere (horizontal parts of the reconnected field lines). A map of Bz is displayed at the base of the photosphere (z = 0). The non-horizontal parts of the reconnected field lines connect down to the edges of the EFR.
Current usage metrics show cumulative count of Article Views (full-text article views including HTML views, PDF and ePub downloads, according to the available data) and Abstracts Views on Vision4Press platform.
Data correspond to usage on the plateform after 2015. The current usage metrics is available 48-96 hours after online publication and is updated daily on week days.
Initial download of the metrics may take a while.