Fig. 13
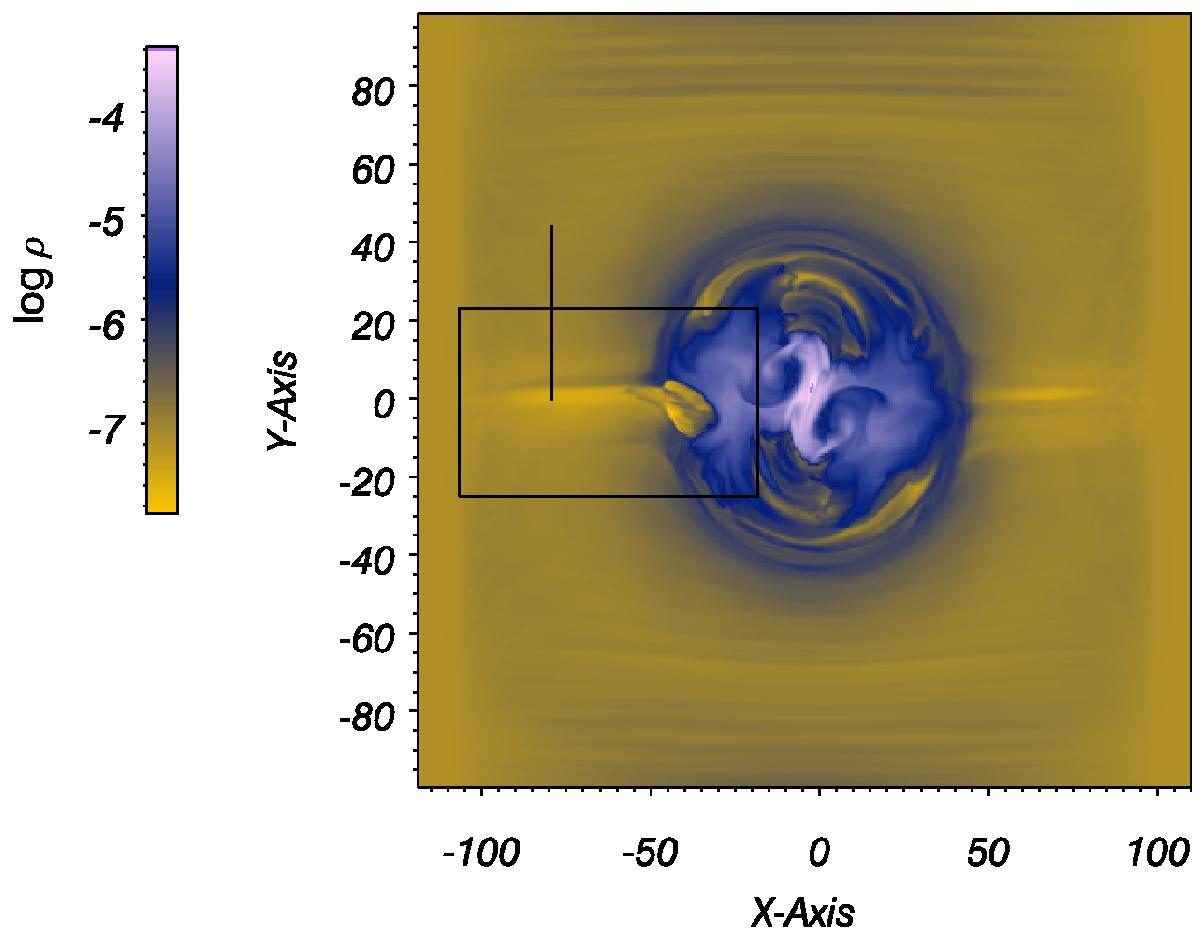
Slice at z = 19 displaying log ρ at t = 126. The sigmoid of the main EFR can be seen at the centre. On either side of this, horizontal surges can clearly be seen. The asymmetry in their formation is due to the presence of the second (perturbative) region. The black rectangle shows the region plotted in Fig. 14 and the vertical line shows the cut taken for Fig. 15.
Current usage metrics show cumulative count of Article Views (full-text article views including HTML views, PDF and ePub downloads, according to the available data) and Abstracts Views on Vision4Press platform.
Data correspond to usage on the plateform after 2015. The current usage metrics is available 48-96 hours after online publication and is updated daily on week days.
Initial download of the metrics may take a while.