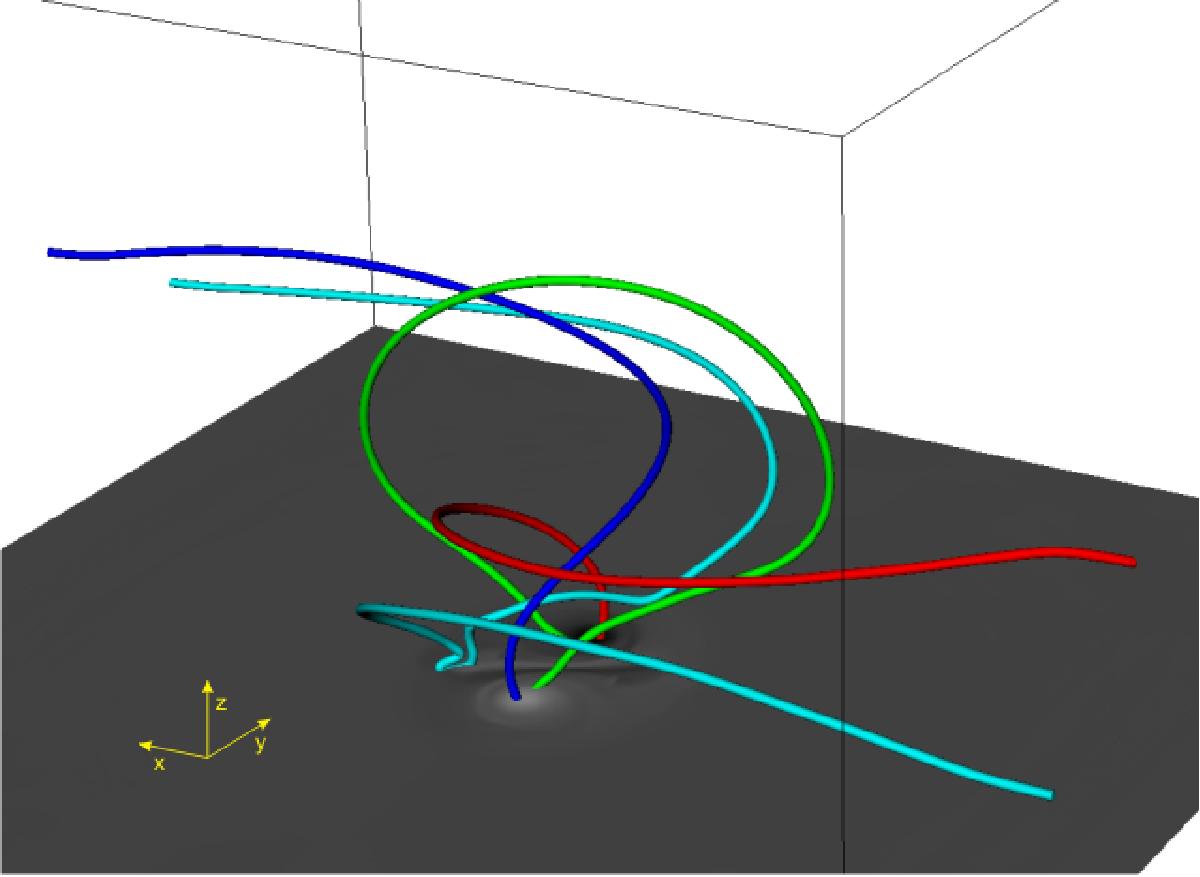
Fig. 10

Particular magnetic field lines showing effects of internal reconnection. These are traced to highlight the magnetic topology of the region after internal reconnection has occured at t = 200. The colour scheme is the same as before. Previously, cyan field lines represented the overlying ambient field. Here, however, there are also cyan field lines that pass within the EFR, as shown here. A map of Bz is placed at z = 0.
Current usage metrics show cumulative count of Article Views (full-text article views including HTML views, PDF and ePub downloads, according to the available data) and Abstracts Views on Vision4Press platform.
Data correspond to usage on the plateform after 2015. The current usage metrics is available 48-96 hours after online publication and is updated daily on week days.
Initial download of the metrics may take a while.


