Fig. 1
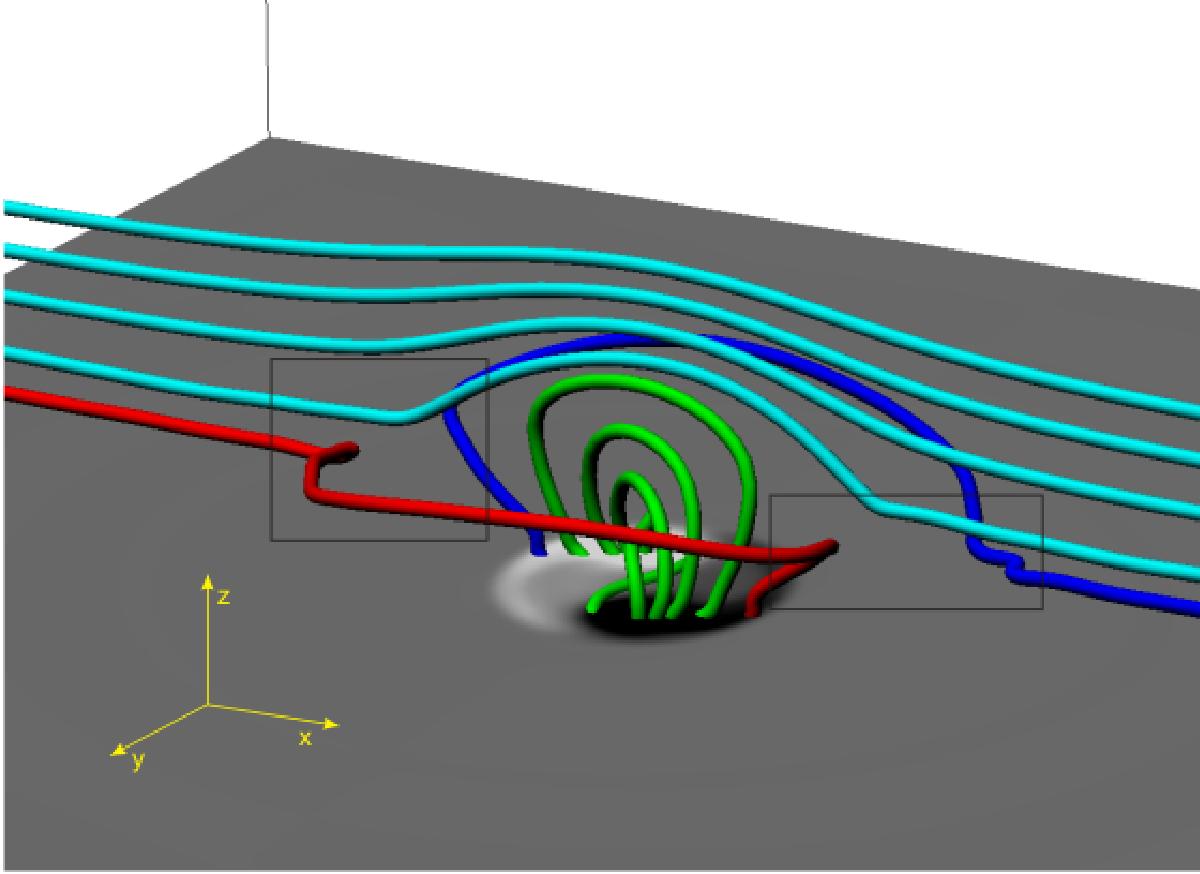
EFR at t = 70. The different flux regions are colour-coded (see text for details). The approximate positions of reconnection are indicated by boxes. At these locations, at a height of z ≈ 10, surges are generated. A map of Bz is displayed at the base of the photosphere (z = 0) and reveals that the reconnected field lines connect down to the edges of the EFR.
Current usage metrics show cumulative count of Article Views (full-text article views including HTML views, PDF and ePub downloads, according to the available data) and Abstracts Views on Vision4Press platform.
Data correspond to usage on the plateform after 2015. The current usage metrics is available 48-96 hours after online publication and is updated daily on week days.
Initial download of the metrics may take a while.