Fig. 3
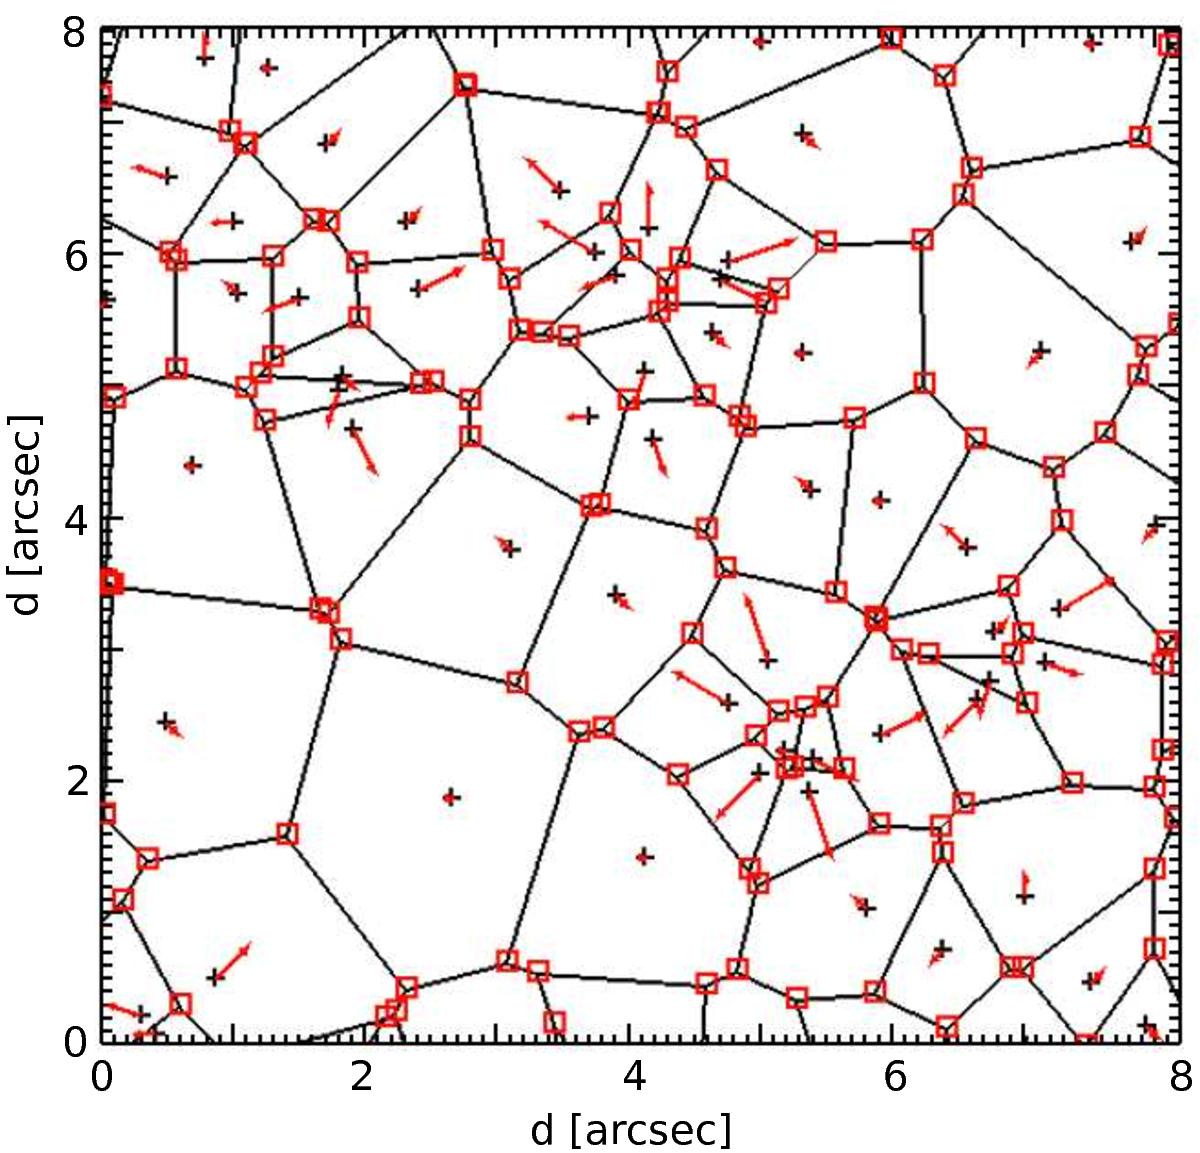
A snapshot from the simulation. The black crosses represent the advection centres; the red vectors are the displacement (5 × exaggeration) to be applied to the centres due to the neighbours’ action; the red boxes on the Voronoi tesselation highlight the cell vertexes, which are used as tracers to compute the displacement spectrum. For the sake of visualization, only about a twentieth of the simulation domain is shown.
Current usage metrics show cumulative count of Article Views (full-text article views including HTML views, PDF and ePub downloads, according to the available data) and Abstracts Views on Vision4Press platform.
Data correspond to usage on the plateform after 2015. The current usage metrics is available 48-96 hours after online publication and is updated daily on week days.
Initial download of the metrics may take a while.