Fig. 8
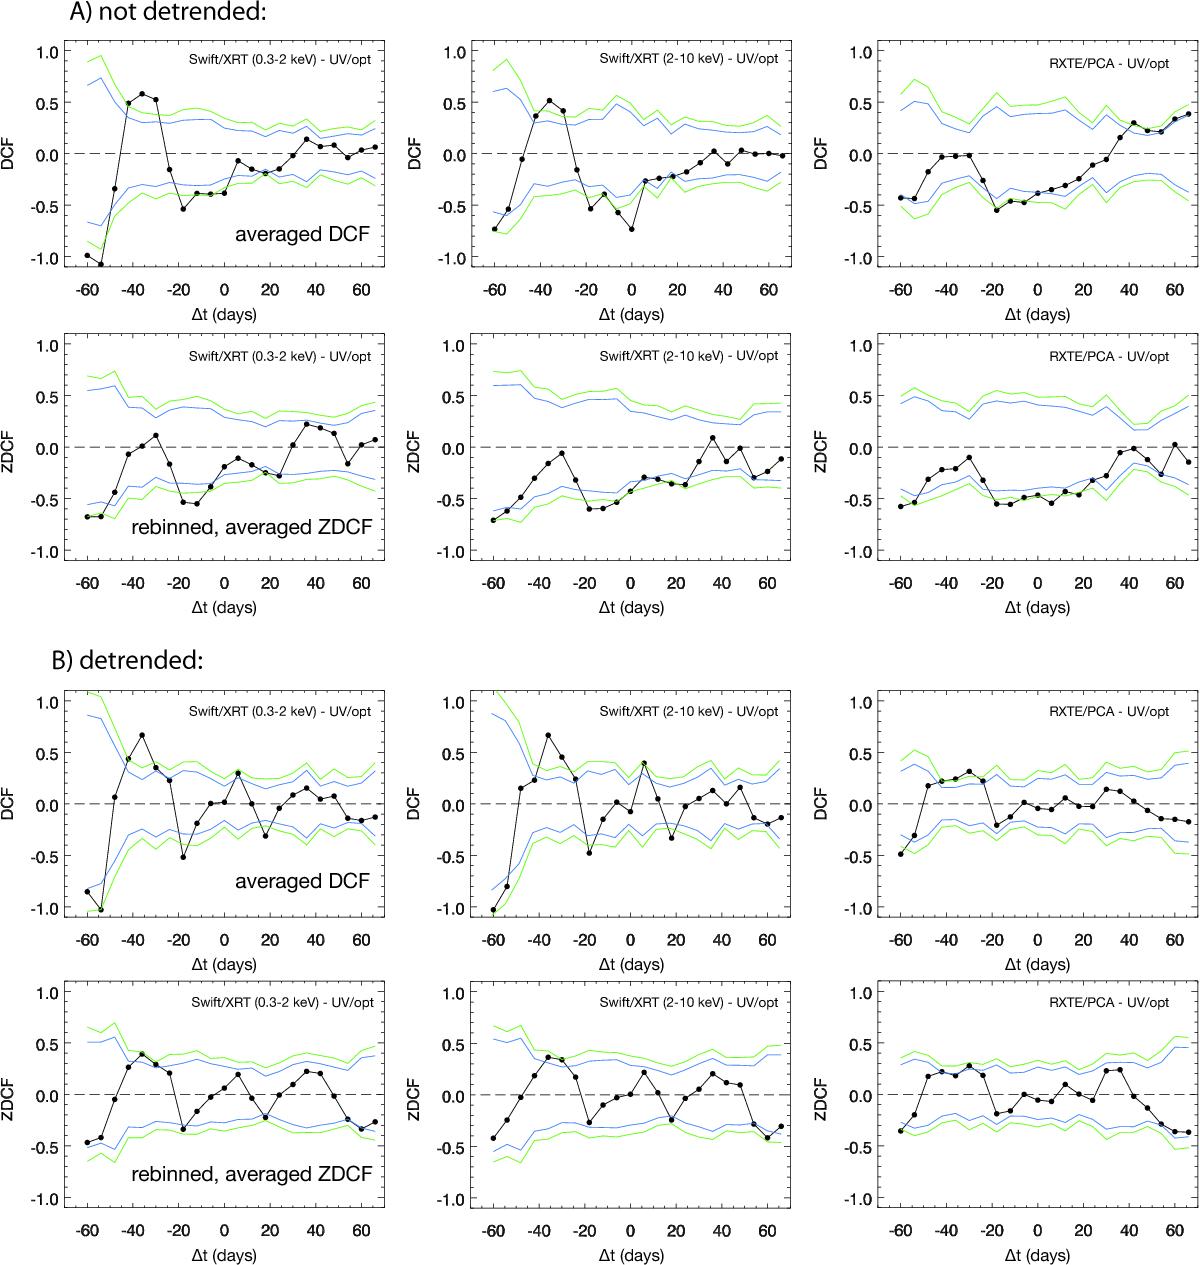
a) DCFs of each X-ray light curve (Swift/XRT (0.3–2 keV), Swift/XRT (2–10 keV) and RXTE/PCA (2–10 keV)), correlated with several optical and UV light curves, are averaged over all optical to UV bands and shown in black in the upper panel. The green lines represent the 1% and 99% extremes of the likewise averaged DCF distribution of simulated optical/UV light curves when correlated with the observed X-ray light curve. The blue lines represent the 5% and 95% extremes. Lower panel: z-transformed DCFs, which were, for the purpose of direct comparison with the DCF, rebinned to the same binning as the DCFs and averaged in the same way. b) Same as a), but all light curves have been detrended (as described in 4.3) before correlation.
Current usage metrics show cumulative count of Article Views (full-text article views including HTML views, PDF and ePub downloads, according to the available data) and Abstracts Views on Vision4Press platform.
Data correspond to usage on the plateform after 2015. The current usage metrics is available 48-96 hours after online publication and is updated daily on week days.
Initial download of the metrics may take a while.