Fig. 6
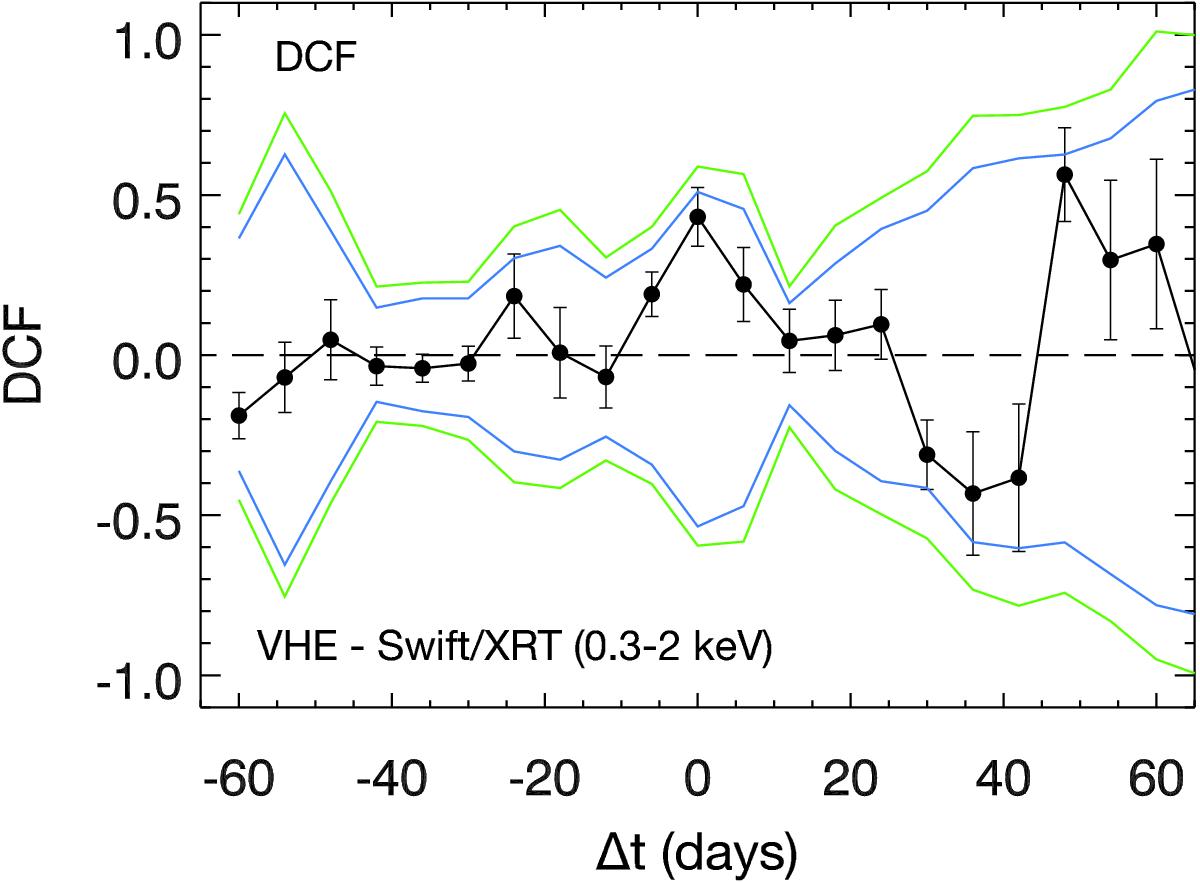
DCF of the combined Whipple and MAGIC (“VHE”) light curve, correlated with the Swift/XRT (0.3–2 keV) light curve. The black error bars represent the uncertainties as derived from Edelson & Krolik (1988). The green lines represent the 1% and 99% extremes of the DCF distribution of simulated Swift/XRT light curves when correlated with the measured VHE light curve. The blue lines represent the 5% and 95% extremes.
Current usage metrics show cumulative count of Article Views (full-text article views including HTML views, PDF and ePub downloads, according to the available data) and Abstracts Views on Vision4Press platform.
Data correspond to usage on the plateform after 2015. The current usage metrics is available 48-96 hours after online publication and is updated daily on week days.
Initial download of the metrics may take a while.