Fig. 5
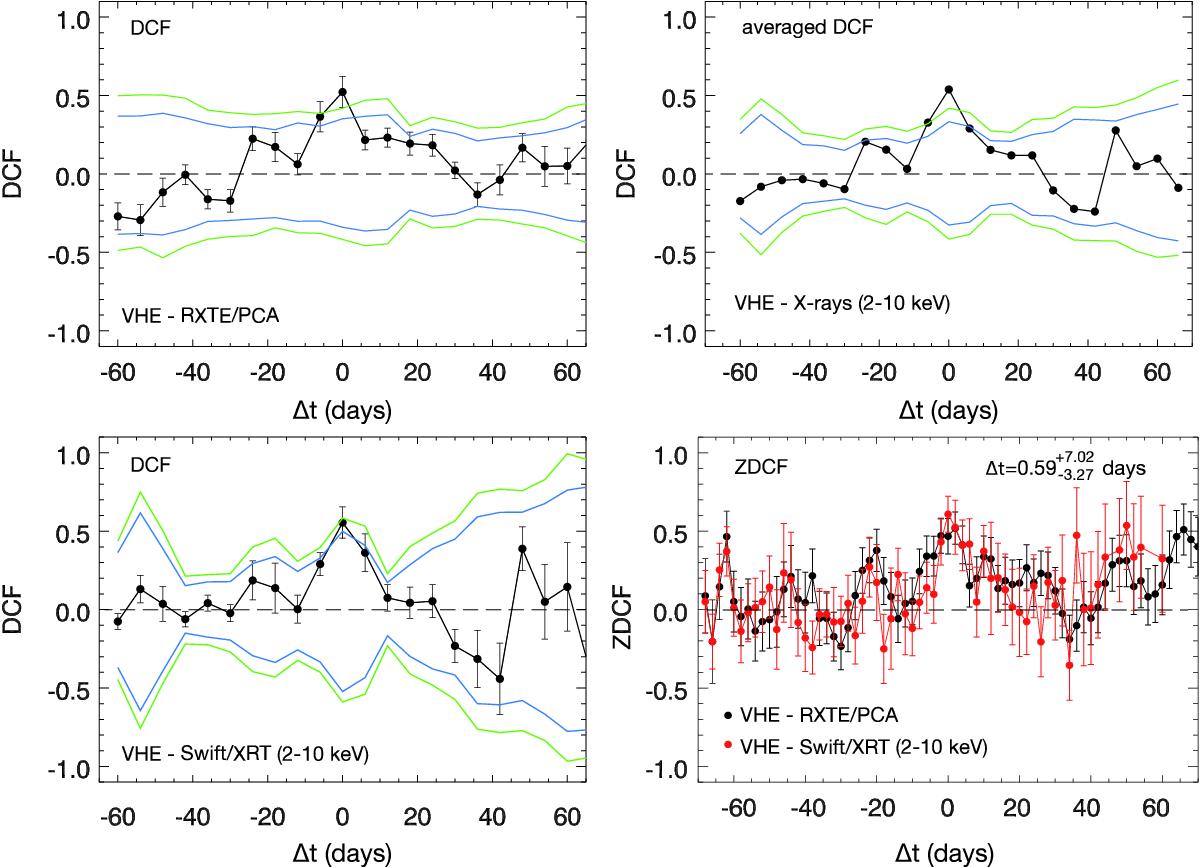
DCF of the combined Whipple and MAGIC (VHE) light curve, correlated with the RXTE/PCA and the Swift/XRT (2–10 keV) light curves are shown in the upper left and lower left panels. The black error bars represent the uncertainties as derived from Edelson & Krolik (1988). The green lines represent the 1% and 99% extremes of the DCF distribution of simulated RXTE/PCA light curves when correlated with the measured VHE light curve. The blue lines represent the 5% and 95% extremes. Upper right panel: average of the VHE–RXTE/PCA and VHE–Swift/XRT (2–10 keV) DCFs, with the corresponding confidence intervals derived from averaging the DCFs of the simulated light curves. See text for details in the calculation of the average DCFs and contours. Lower right panel: z-transformed DCFs.
Current usage metrics show cumulative count of Article Views (full-text article views including HTML views, PDF and ePub downloads, according to the available data) and Abstracts Views on Vision4Press platform.
Data correspond to usage on the plateform after 2015. The current usage metrics is available 48-96 hours after online publication and is updated daily on week days.
Initial download of the metrics may take a while.