Fig. A.2
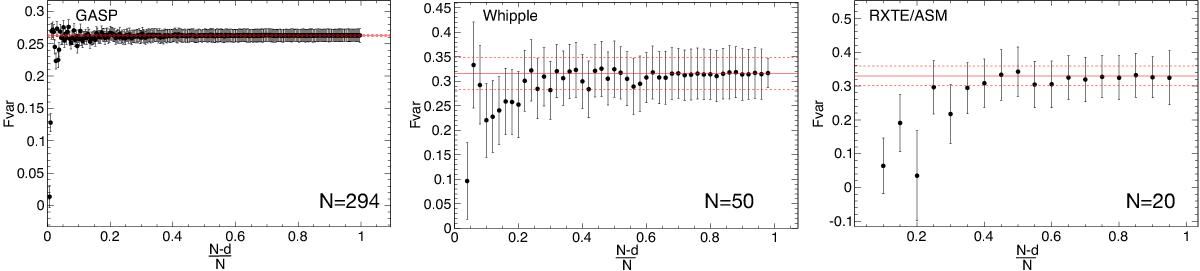
Fractional variability Fvar (red) as a function of (N − d) /N for the jackknife-d samples of selected representative light curves. The measured Fvar of the original light curve and its error are shown as red horizontal lines. The Fvar of the jackknife-samples is constant and agrees with the original Fvar within its errors for all but the largest d (i.e., the smallest jackknife-samples).
Current usage metrics show cumulative count of Article Views (full-text article views including HTML views, PDF and ePub downloads, according to the available data) and Abstracts Views on Vision4Press platform.
Data correspond to usage on the plateform after 2015. The current usage metrics is available 48-96 hours after online publication and is updated daily on week days.
Initial download of the metrics may take a while.