Free Access
Fig. 11
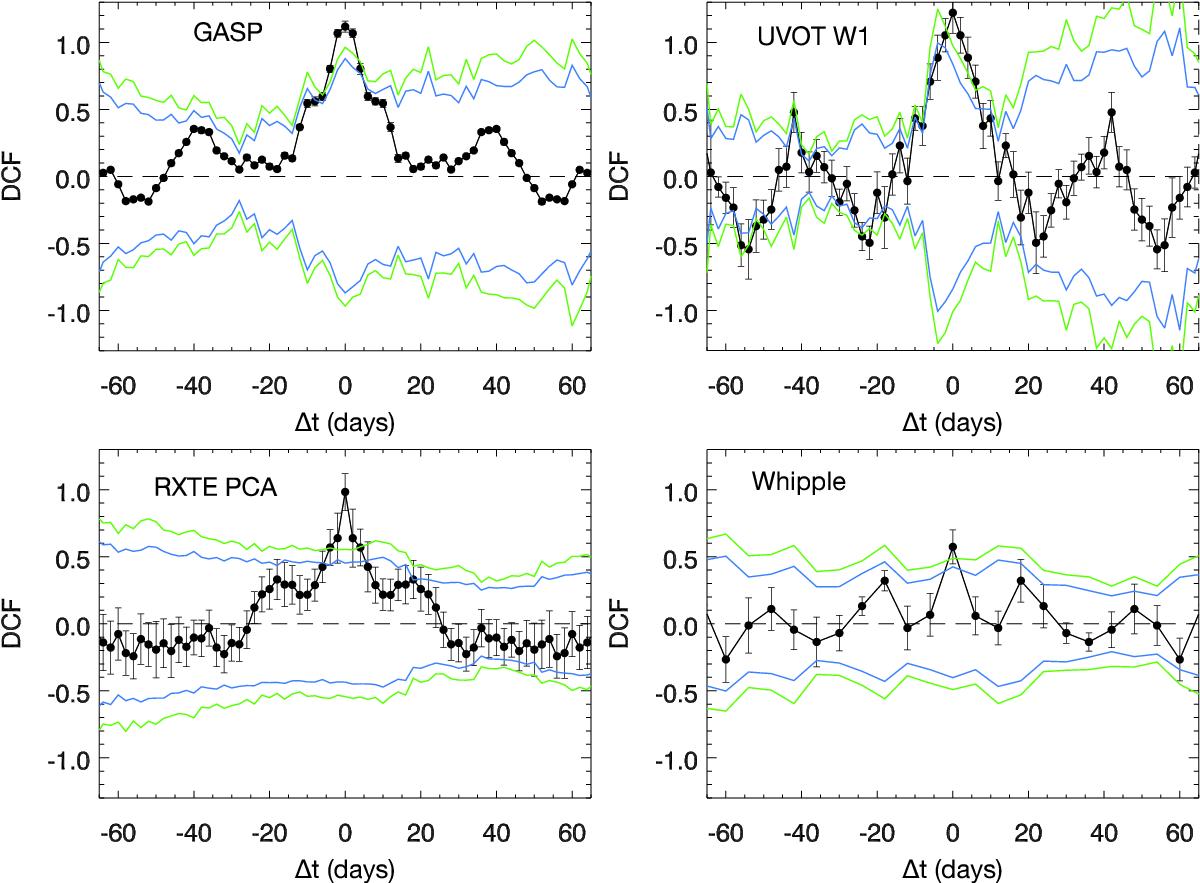
Discrete auto-correlation function for a few light curves are shown in black. The green lines represent the 1% and 99% extremes of the likewise averaged DACF distribution of simulated light curves when correlated with themselves. The blue lines represent the 5% and 95% extremes.
Current usage metrics show cumulative count of Article Views (full-text article views including HTML views, PDF and ePub downloads, according to the available data) and Abstracts Views on Vision4Press platform.
Data correspond to usage on the plateform after 2015. The current usage metrics is available 48-96 hours after online publication and is updated daily on week days.
Initial download of the metrics may take a while.