Fig. 1
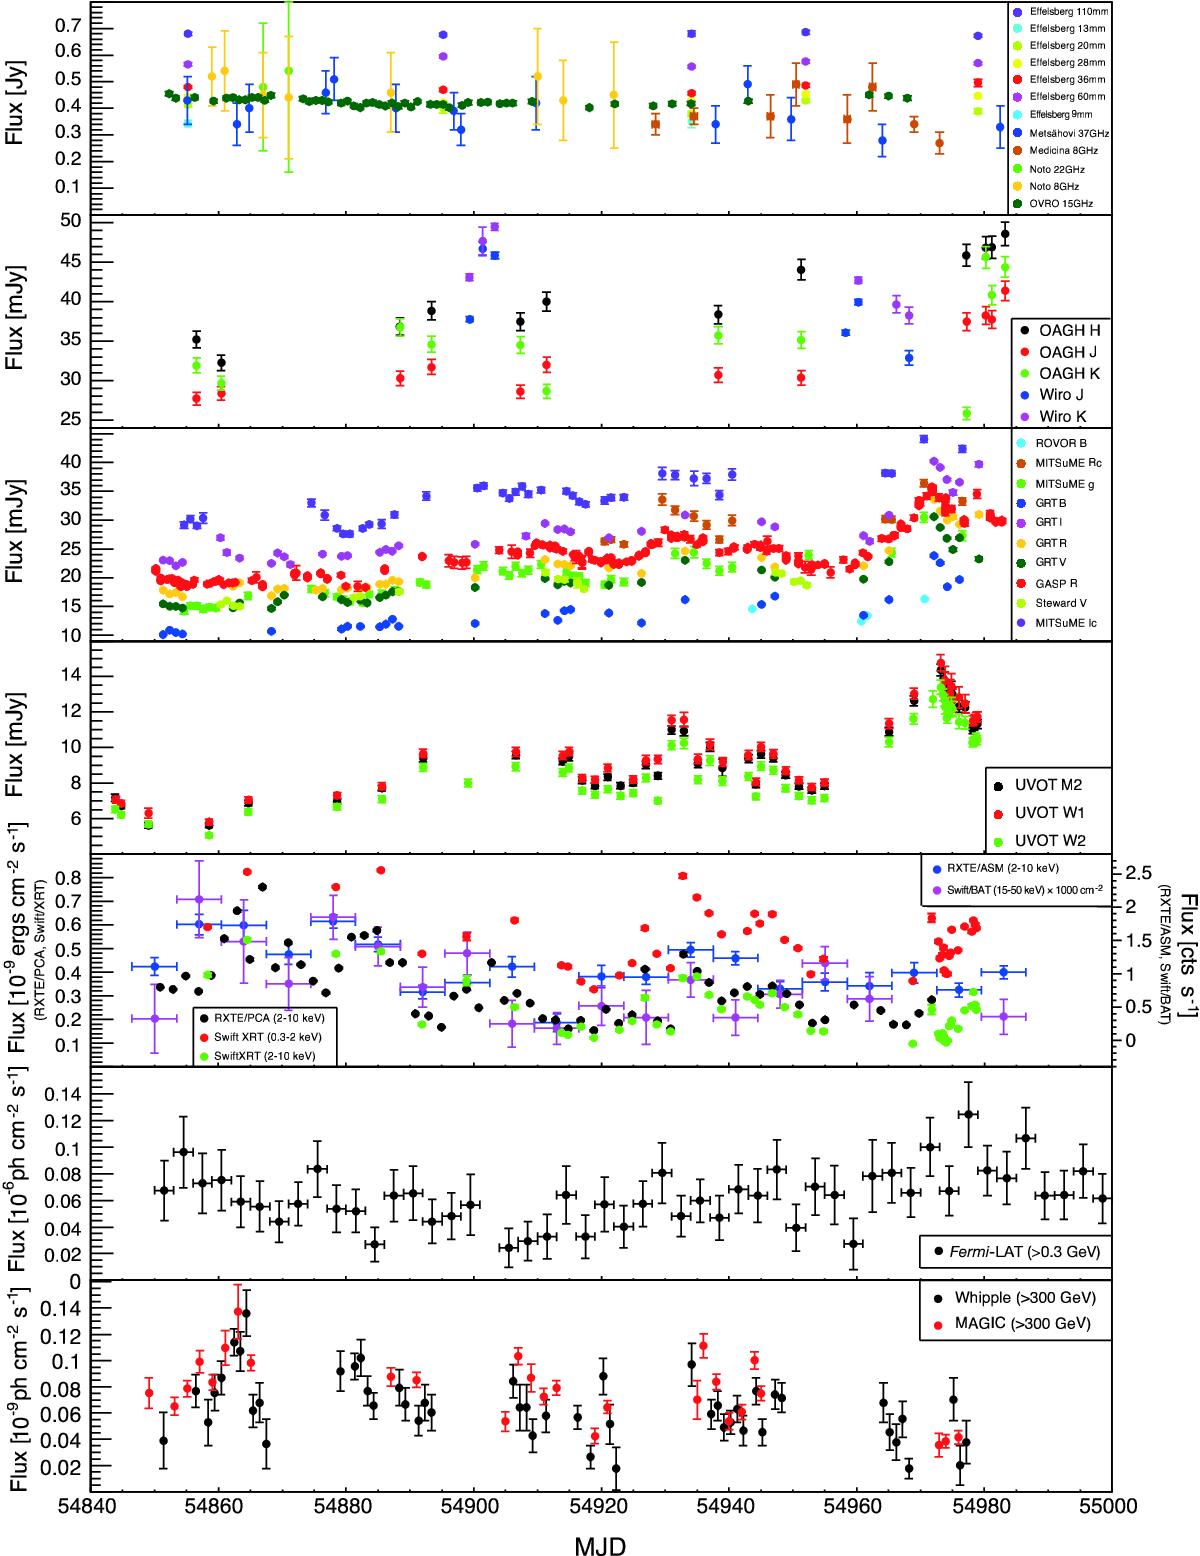
Light curves of Mrk 421 from radio to VHE from 2009 January 19 (MJD 54 850) to 2009 June 1st (MJD 54 983). Vertical bars denote flux measurement errors, and the horizontal bars denote the time bin widths into which some of the light curves are binned. The Fermi-LAT photon fluxes are integrated over a three-day-long time interval. The Whipple 10-m data (with an energy threshold of 400 GeV) were converted into fluxes above 300 GeV using a power-law spectrum with index of 2.5.
Current usage metrics show cumulative count of Article Views (full-text article views including HTML views, PDF and ePub downloads, according to the available data) and Abstracts Views on Vision4Press platform.
Data correspond to usage on the plateform after 2015. The current usage metrics is available 48-96 hours after online publication and is updated daily on week days.
Initial download of the metrics may take a while.