Fig. 2
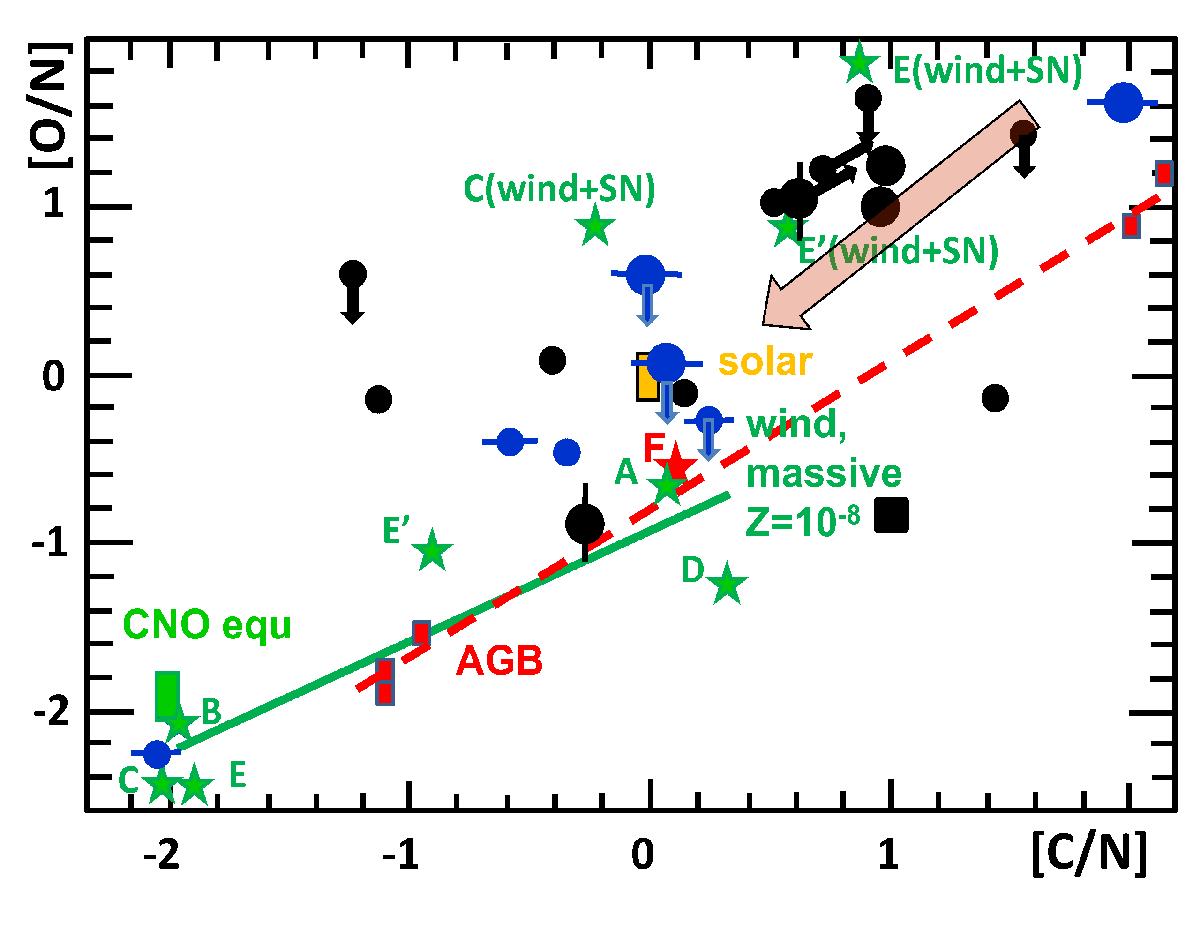
Comparison of the abundance ratios [O/N] and [C/N] of CEMP-no stars with model data. The same codes as in Fig. 1 are adopted to represent the observations and models. The small red rectangles show the AGB models by Herwig (2004) connected by a red broken line. The general trend of the CNO burning is represented by a big reddish arrow. The small vertical arrows indicate upper limits for [O/Fe] and the small oblique arrows upper limits for [N/Fe]. The star HE 1201-1512 was not indicated because of many lower limits.
Current usage metrics show cumulative count of Article Views (full-text article views including HTML views, PDF and ePub downloads, according to the available data) and Abstracts Views on Vision4Press platform.
Data correspond to usage on the plateform after 2015. The current usage metrics is available 48-96 hours after online publication and is updated daily on week days.
Initial download of the metrics may take a while.