Fig. 1
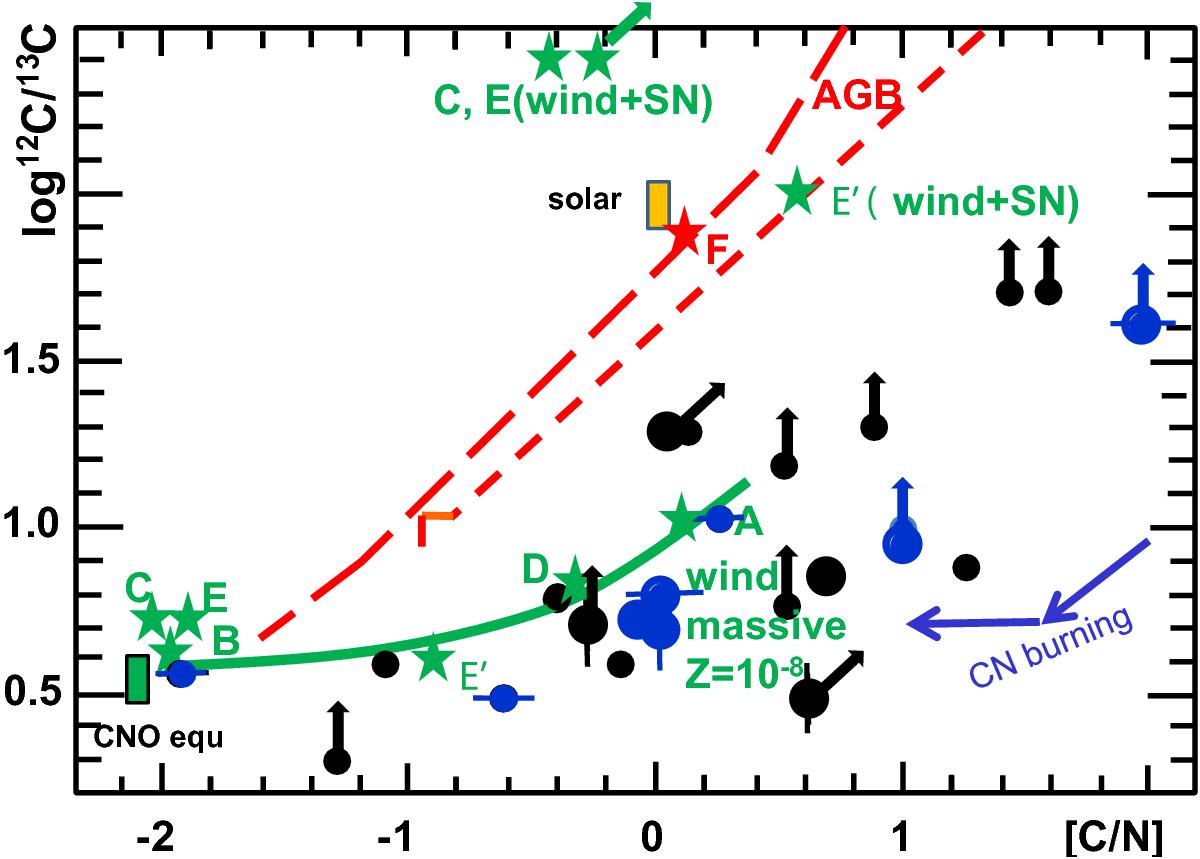
Observations of 12C/13C ratios vs. [C/N], represented by black dots (Norris et al. 2013) and blue dots (Masseron et al. 2010). (The observations by Allen et al. (2012), represented by black squares in other figures, do not appear in this plot, because these authors do not provide data for the C-isotopes.) A vertical bar indicates MS or subgiant stars with low Li content, and a horizontal bar indicates CEMP-no or low-s stars by Masseron et al. which are also cataloged as “b-” by Allen et al. The big points apply to MS stars or to subgiants close to the turnoff with Teff> 5500 K and log g ≥ 3.25, as by Norris et al. (2013), while the small points represent the bright giants with lower Teff and log g. The Li-poor star G 77-61, which has Teff = 4000 K and log g = 5.05, is considered as a dwarf (Plez & Cohen 2005), so it is represented by a big point. Some of the 12C/13C values are lower bounds indicated by a vertical arrow. If at the same time, the N value is an upper bound, the arrow is oblique. Rectangles indicate the solar value and the CNO equilibrium value. AGB models with Z = 10-4 are indicated by broken red lines, the upper line comes from Karakas & Lattanzio (2007) in the range of 1 to 6 M⊙, and the lower one is by Herwig (2004) in the range of 2 to 6 M⊙ (Masseron et al. 2010), the low masses being on the top and the high ones at the bottom of the lines. A red star shows a fast-rotating AGB model of 7 M⊙ with Z = 10-5 (model F) by Meynet et al. (2010). Green stars show models of rapidly rotating massive stars A, B, C, D with masses from 40 to 85 M⊙ and Z = 10-8 from Hirschi (2007). Model E and E′ have a mass of 60 M⊙ with Z = 10-5 and are given in Table 4 by Meynet et al. (2006), respectively the left and right columns; they differ by the value of the mass loss rates (higher in E′). A parenthesis (wind+SN) indicates the values when both the wind and the supernova contributions are counted. The approximate directions of CN burning is indicated by blue arrows.
Current usage metrics show cumulative count of Article Views (full-text article views including HTML views, PDF and ePub downloads, according to the available data) and Abstracts Views on Vision4Press platform.
Data correspond to usage on the plateform after 2015. The current usage metrics is available 48-96 hours after online publication and is updated daily on week days.
Initial download of the metrics may take a while.