Fig. 5
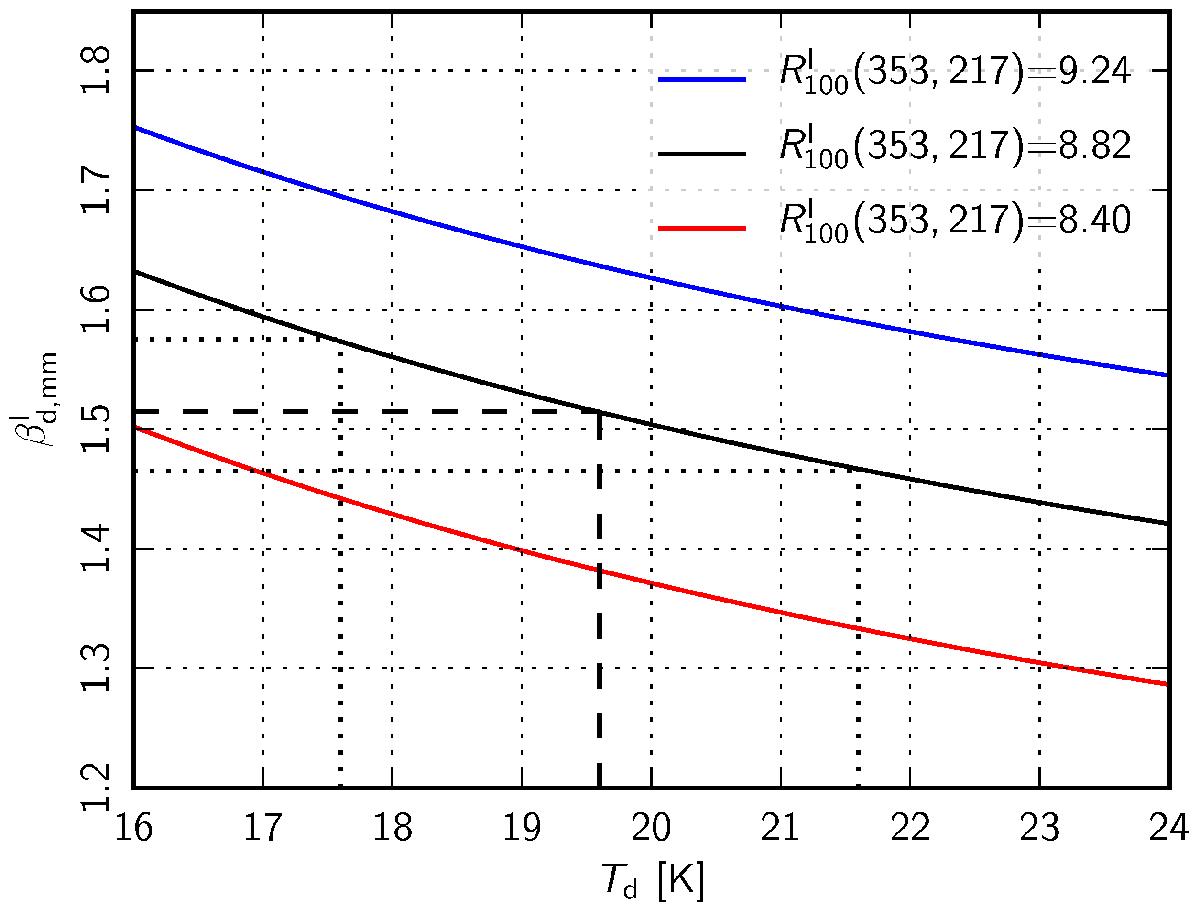
Variation of ![]() with Td for
constant values of
with Td for
constant values of ![]() . The dashed line corresponds to a
mean Td =
19.6 K and
. The dashed line corresponds to a
mean Td =
19.6 K and ![]() for the best-fit value of
for the best-fit value of
![]() . The two dotted line lines
correspond to a change in Td of ±2 K about its mean value, resulting
in change of
. The two dotted line lines
correspond to a change in Td of ±2 K about its mean value, resulting
in change of ![]() value of ±0.05.
value of ±0.05.
Current usage metrics show cumulative count of Article Views (full-text article views including HTML views, PDF and ePub downloads, according to the available data) and Abstracts Views on Vision4Press platform.
Data correspond to usage on the plateform after 2015. The current usage metrics is available 48-96 hours after online publication and is updated daily on week days.
Initial download of the metrics may take a while.