Fig. 3
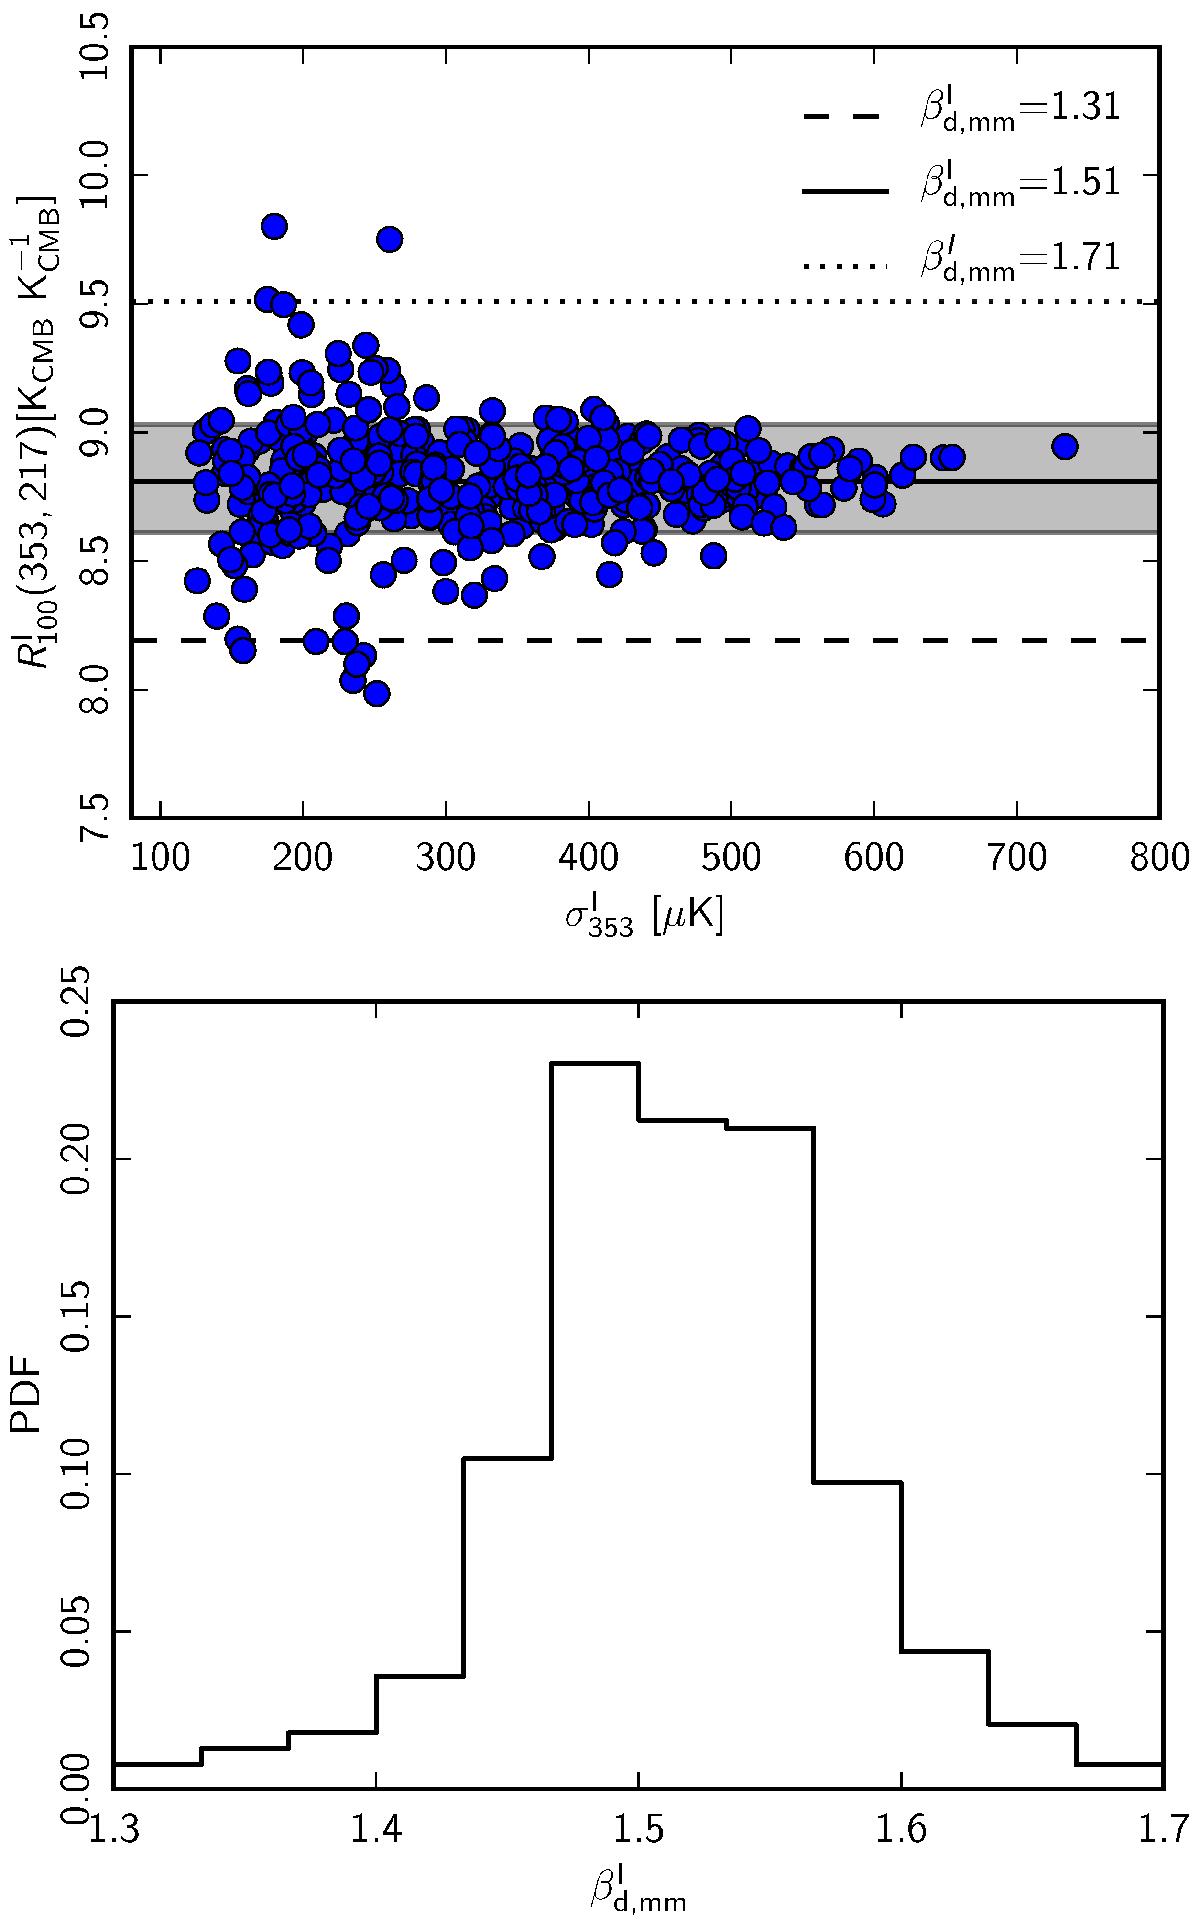
Top: colour ratio ![]() versus dispersion of the
353 GHz template
versus dispersion of the
353 GHz template
![]() for each sky patch. The
1σ
dispersion of the
for each sky patch. The
1σ
dispersion of the ![]() values is shown as the shaded grey
area. The mean ratio corresponds to a spectral index of 1.51 (solid line) for a mean
Td =
19.6 K. Bottom: probability distribution
function (PDF) of the
values is shown as the shaded grey
area. The mean ratio corresponds to a spectral index of 1.51 (solid line) for a mean
Td =
19.6 K. Bottom: probability distribution
function (PDF) of the ![]() values derived from
values derived from
![]() using the specific value of
Td for each sky patch. The measured
1σ
dispersion of
using the specific value of
Td for each sky patch. The measured
1σ
dispersion of ![]() is 0.07.
is 0.07.
Current usage metrics show cumulative count of Article Views (full-text article views including HTML views, PDF and ePub downloads, according to the available data) and Abstracts Views on Vision4Press platform.
Data correspond to usage on the plateform after 2015. The current usage metrics is available 48-96 hours after online publication and is updated daily on week days.
Initial download of the metrics may take a while.