Fig. 4
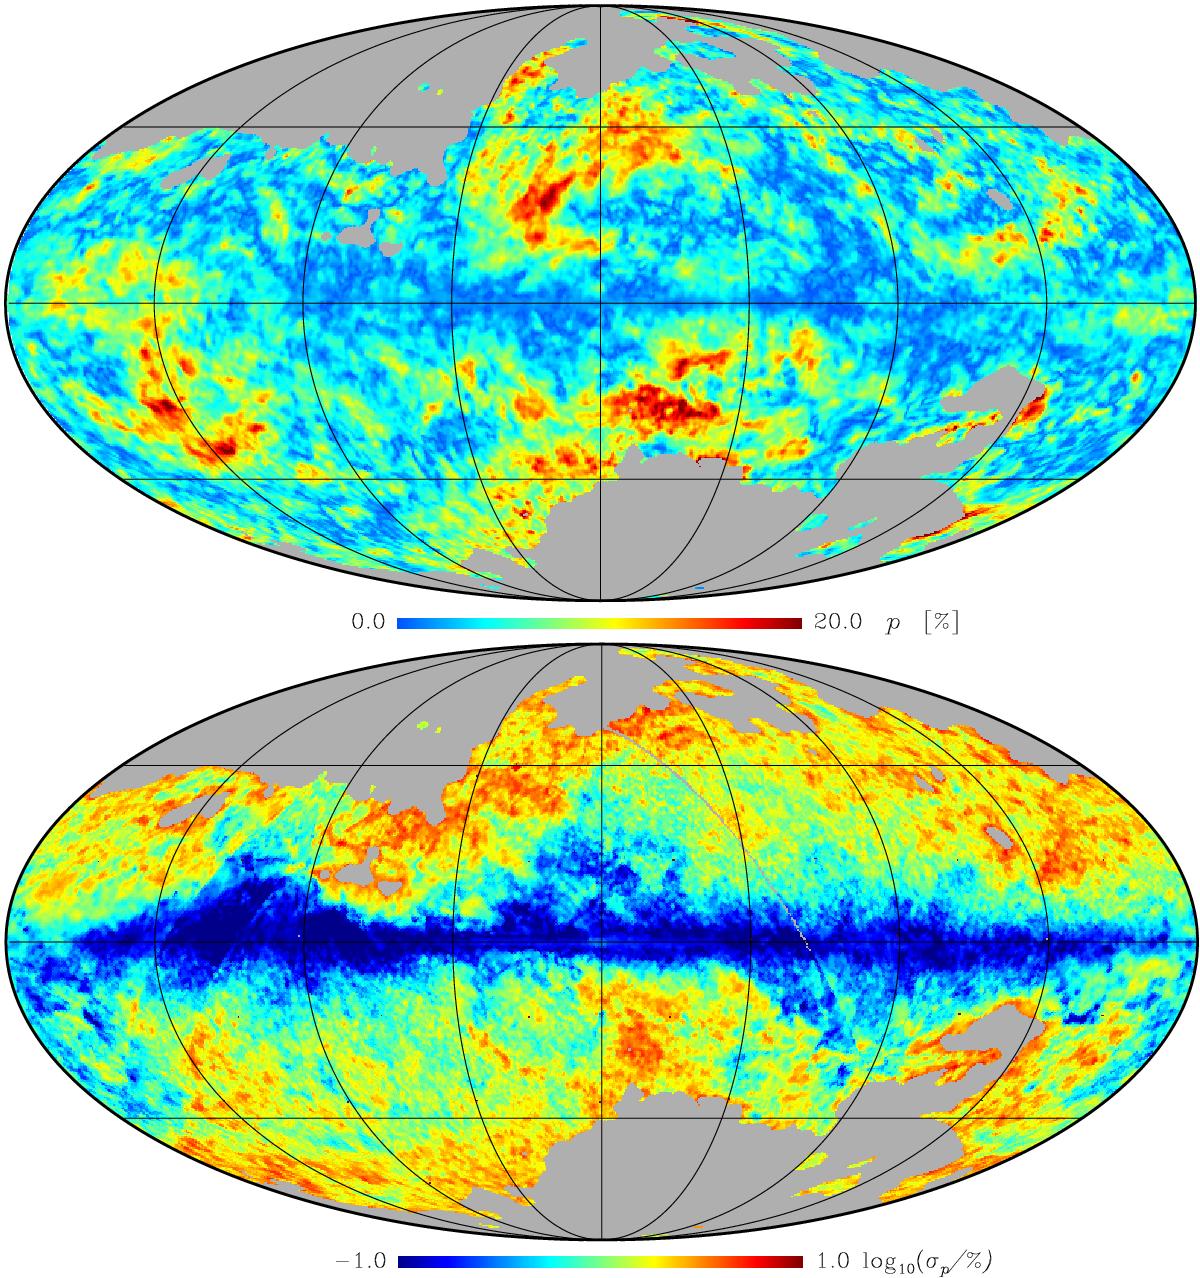
Upper: map of the 353 GHz polarization fraction p at 1° resolution. The colour scale is linear and ranges from 0% to 20%. Lower: map of the 353 GHz polarization fraction uncertainty, σp, at 1° resolution in log 10 scale. The colour scale is from σp = 0.1% to σp = 10%. The data are not shown in the grey areas where the dust emission is not dominant or where residuals were identified comparing individual surveys (see Sect. 2.4). The polarization fraction is obtained using the Bayesian method with a mean posterior estimator (see Sect. 2.3). The uncertainty map includes statistical and systematic contributions. The same mask as in Fig. 1 is applied.
Current usage metrics show cumulative count of Article Views (full-text article views including HTML views, PDF and ePub downloads, according to the available data) and Abstracts Views on Vision4Press platform.
Data correspond to usage on the plateform after 2015. The current usage metrics is available 48-96 hours after online publication and is updated daily on week days.
Initial download of the metrics may take a while.