Free Access
Fig. 23
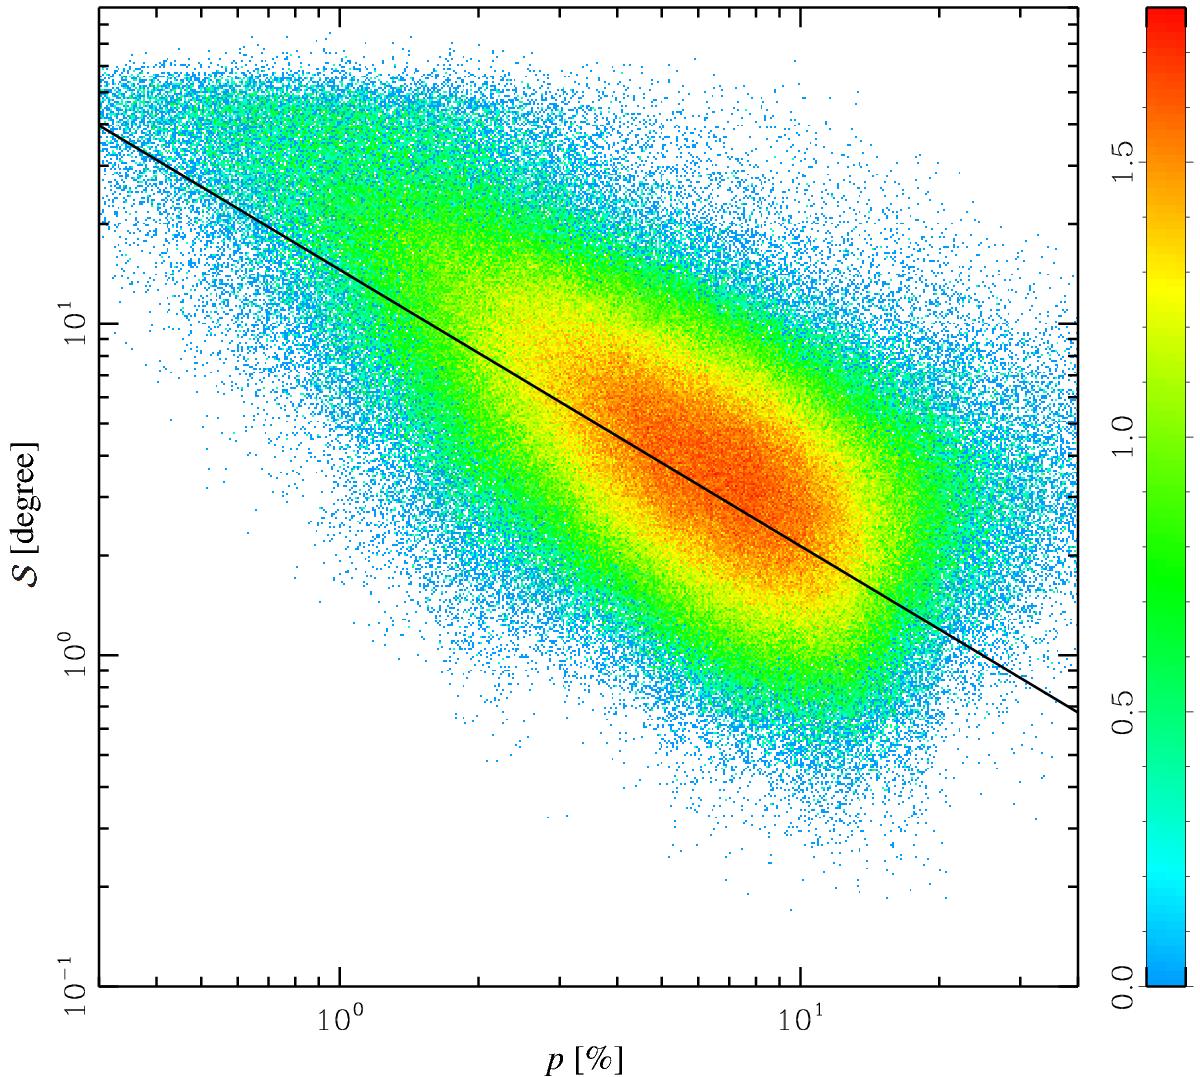
Scatter plot of the polarization angle dispersion function
![]() as a function of polarization fraction p at 353 GHz. The colour scale shows the pixel
density on a log10 scale. The line indicates the best fit (see text).
as a function of polarization fraction p at 353 GHz. The colour scale shows the pixel
density on a log10 scale. The line indicates the best fit (see text).
Current usage metrics show cumulative count of Article Views (full-text article views including HTML views, PDF and ePub downloads, according to the available data) and Abstracts Views on Vision4Press platform.
Data correspond to usage on the plateform after 2015. The current usage metrics is available 48-96 hours after online publication and is updated daily on week days.
Initial download of the metrics may take a while.