Fig. 21
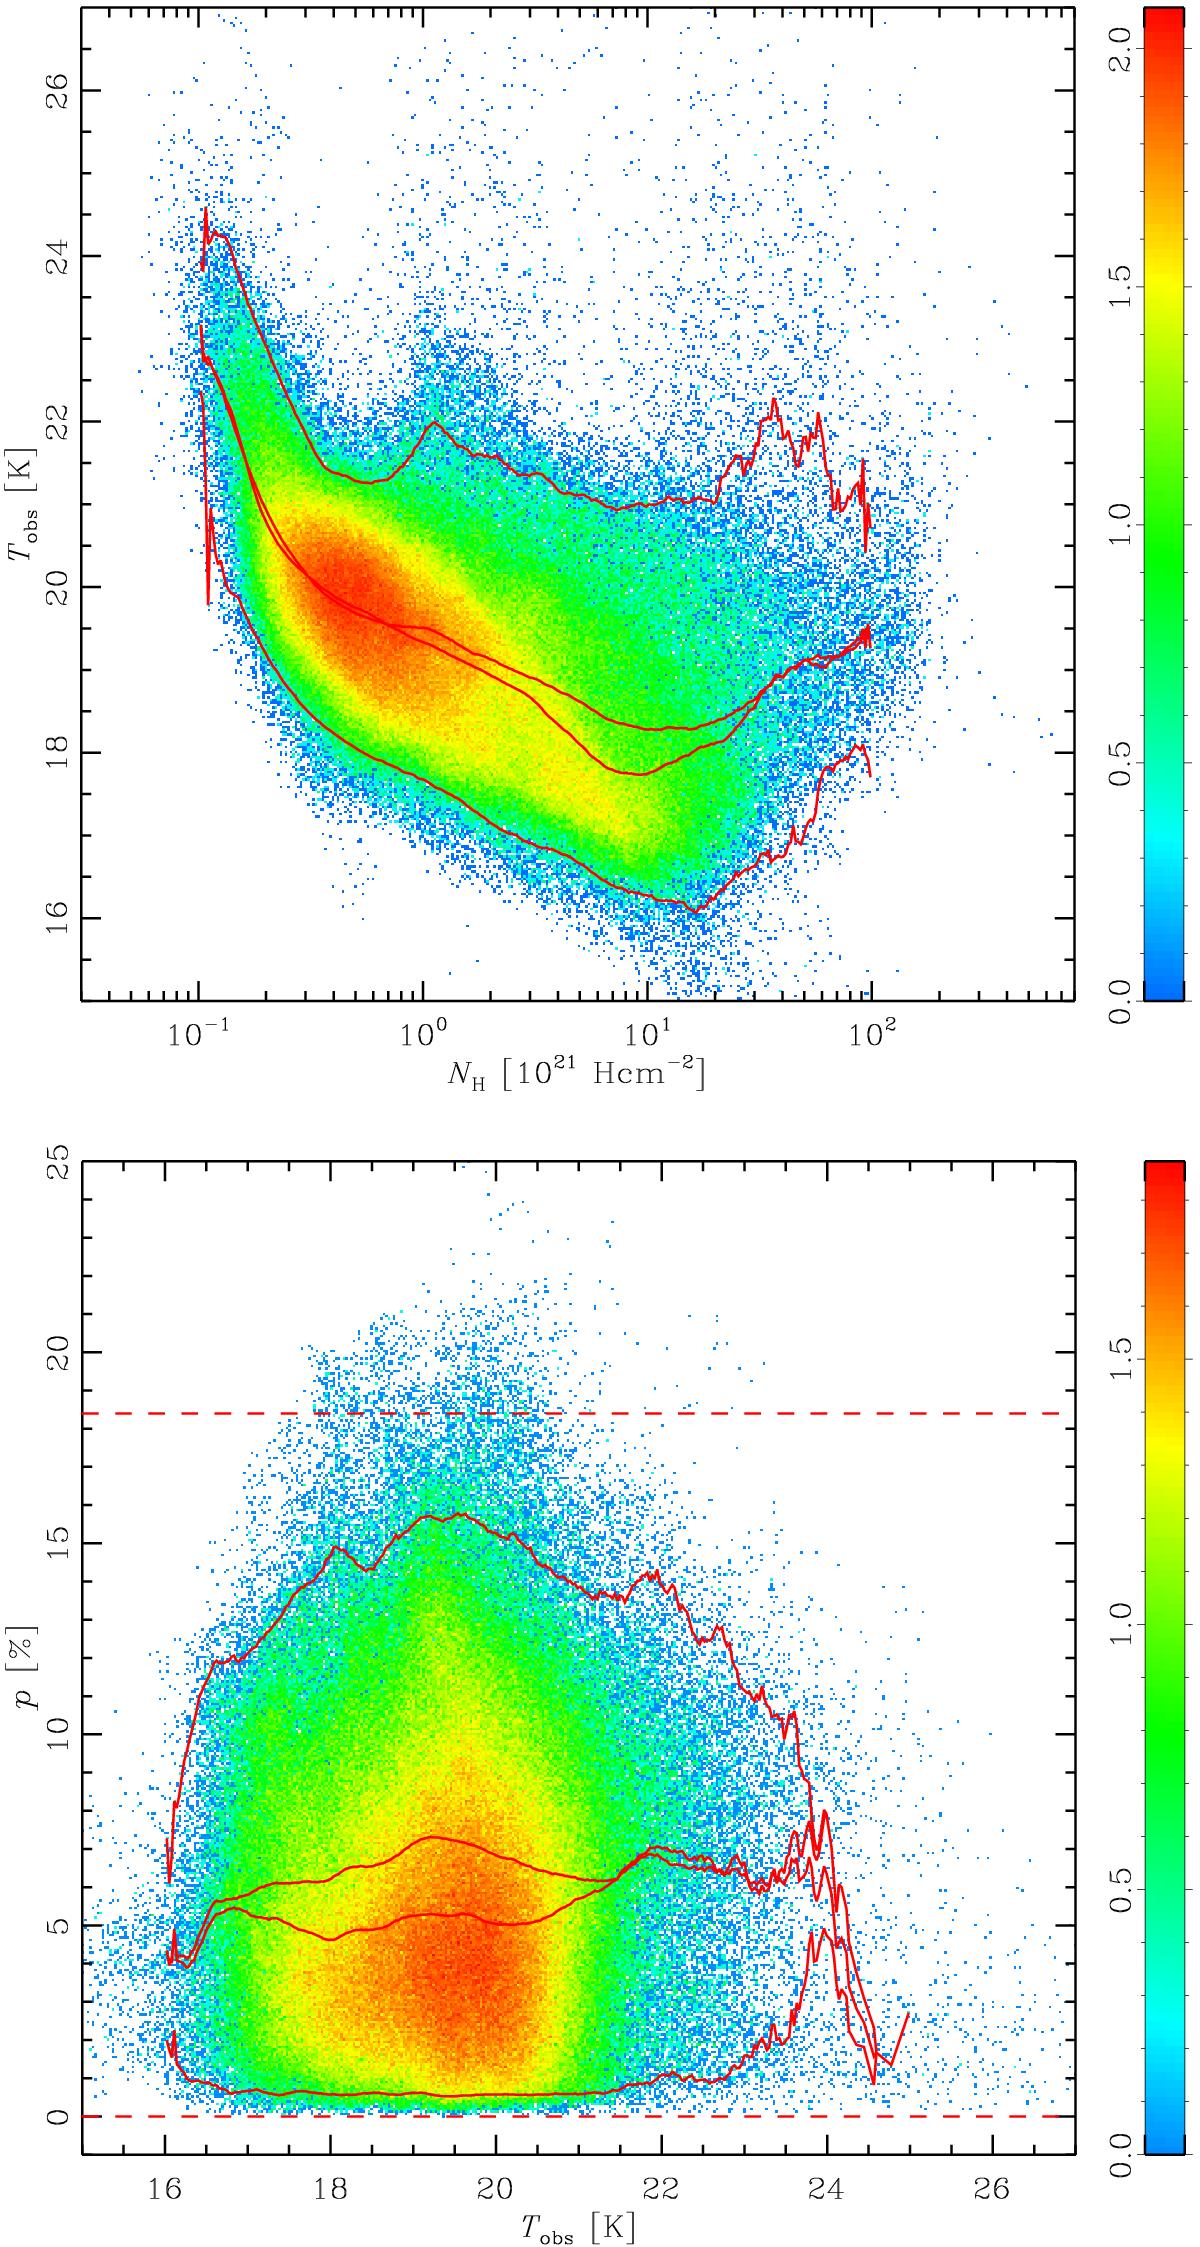
Top: distribution of the apparent dust temperature (Tobs) and column density, as derived in Planck Collaboration XI (2014). Bottom: distribution of the polarization fraction (p) as a function of Tobs in regions of the sky excluding the inner Galactic plane (excluding ℓII < 90deg or ℓII> 270deg, | bII | < 2°). Both plots are for pixels not masked in Fig. 1. The colour scale shows the pixel density on a log10 scale. The curves show, from top to bottom, the evolution of the upper 1% percentile, mean, median and lower 1% percentile of p. Horizontal dashed lines show the location of p = 0 and pmax = 19.8%.
Current usage metrics show cumulative count of Article Views (full-text article views including HTML views, PDF and ePub downloads, according to the available data) and Abstracts Views on Vision4Press platform.
Data correspond to usage on the plateform after 2015. The current usage metrics is available 48-96 hours after online publication and is updated daily on week days.
Initial download of the metrics may take a while.