Fig. 17
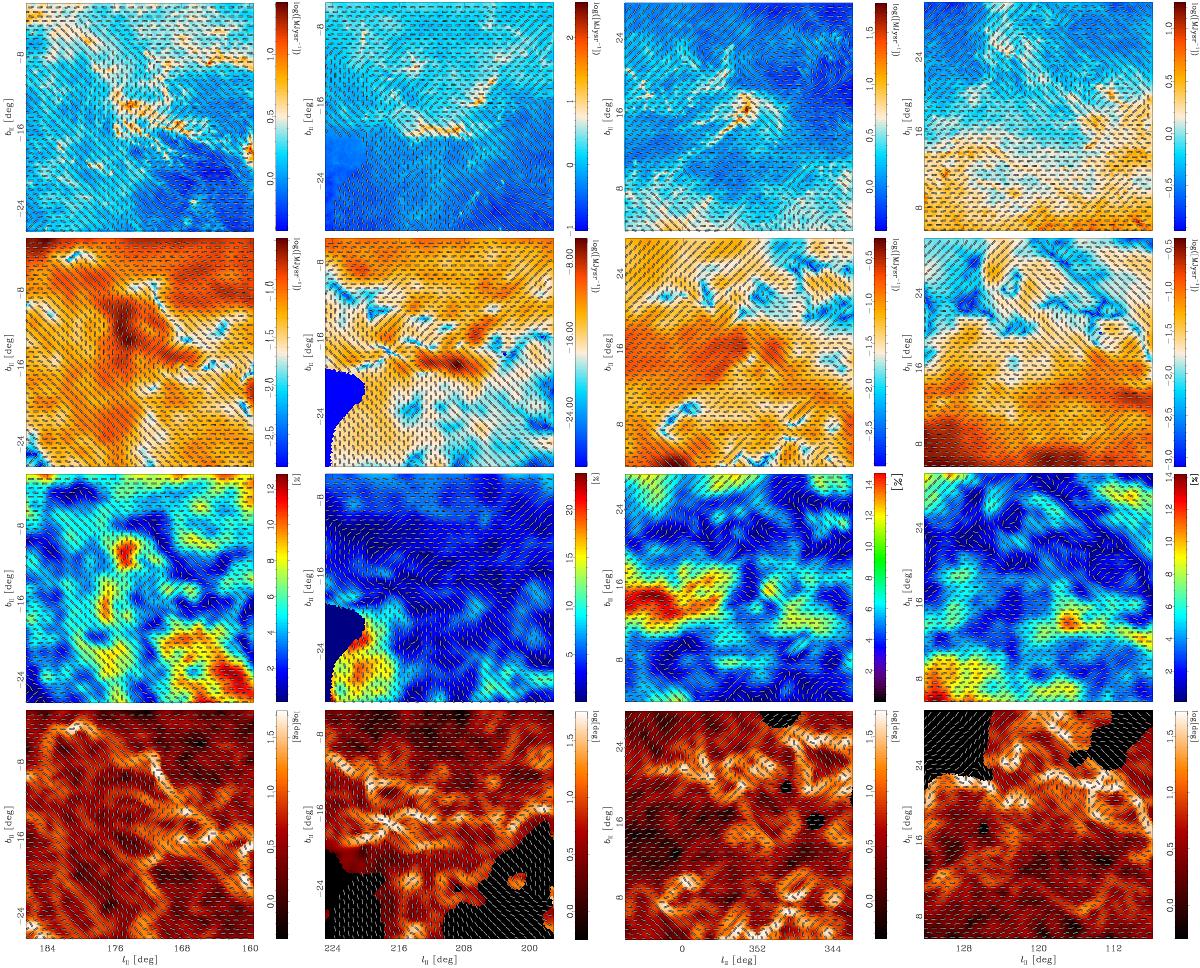
Maps of a few selected regions illustrating the relation between polarization
fraction and polarization angle dispersion function. Rows from top to bottom
show total intensity at 353
GHz, polarized intensity, polarization fraction, and polarization
angle dispersion function, ![]() .
Columns from left to right are for Taurus, Orion, Ophiuchus, and
Polaris. The polarization segments show the orientation of the apparent magnetic
field, but their length is constant, not reflecting the changing polarization
fraction. Note that the boundaries of the regions shown here do not match exactly
those in Table 1 and Fig. 6.
.
Columns from left to right are for Taurus, Orion, Ophiuchus, and
Polaris. The polarization segments show the orientation of the apparent magnetic
field, but their length is constant, not reflecting the changing polarization
fraction. Note that the boundaries of the regions shown here do not match exactly
those in Table 1 and Fig. 6.
Current usage metrics show cumulative count of Article Views (full-text article views including HTML views, PDF and ePub downloads, according to the available data) and Abstracts Views on Vision4Press platform.
Data correspond to usage on the plateform after 2015. The current usage metrics is available 48-96 hours after online publication and is updated daily on week days.
Initial download of the metrics may take a while.