Fig. 12
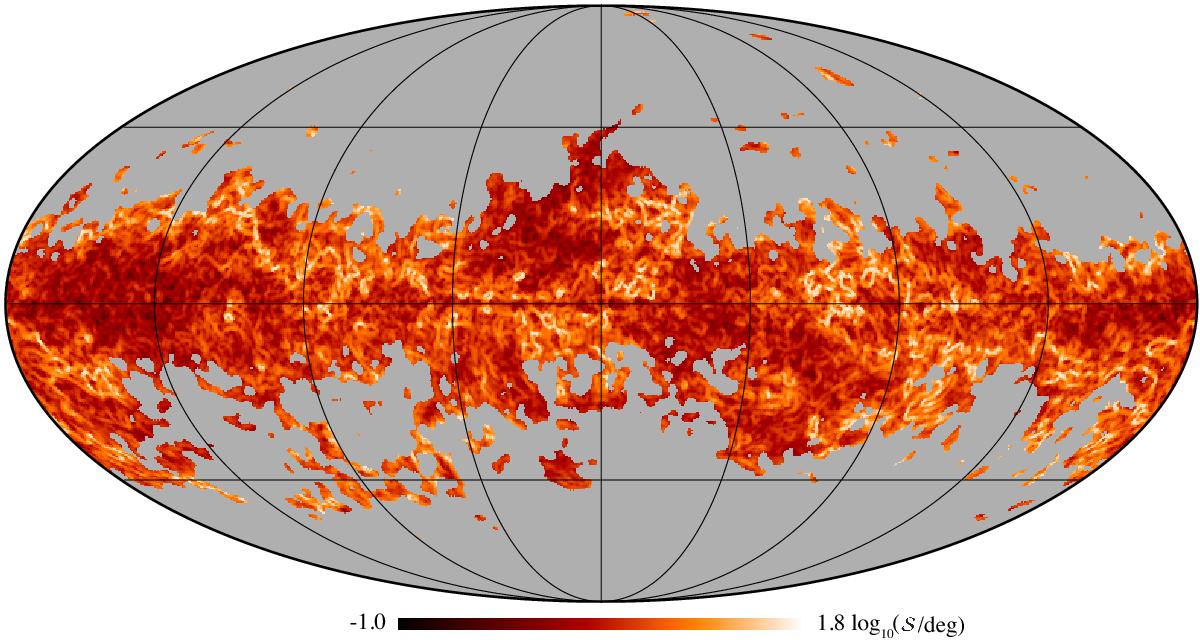
Map of the polarization angle dispersion function
![]() at 353 GHz with
1° resolution and for
lag δ =
30′. The map is shown in log 10 scale over the range
at 353 GHz with
1° resolution and for
lag δ =
30′. The map is shown in log 10 scale over the range
![]() . Only sky regions where the
S/N on
. Only sky regions where the
S/N on ![]() is larger than 3 are shown (see text).
is larger than 3 are shown (see text).
Current usage metrics show cumulative count of Article Views (full-text article views including HTML views, PDF and ePub downloads, according to the available data) and Abstracts Views on Vision4Press platform.
Data correspond to usage on the plateform after 2015. The current usage metrics is available 48-96 hours after online publication and is updated daily on week days.
Initial download of the metrics may take a while.