Fig. 10
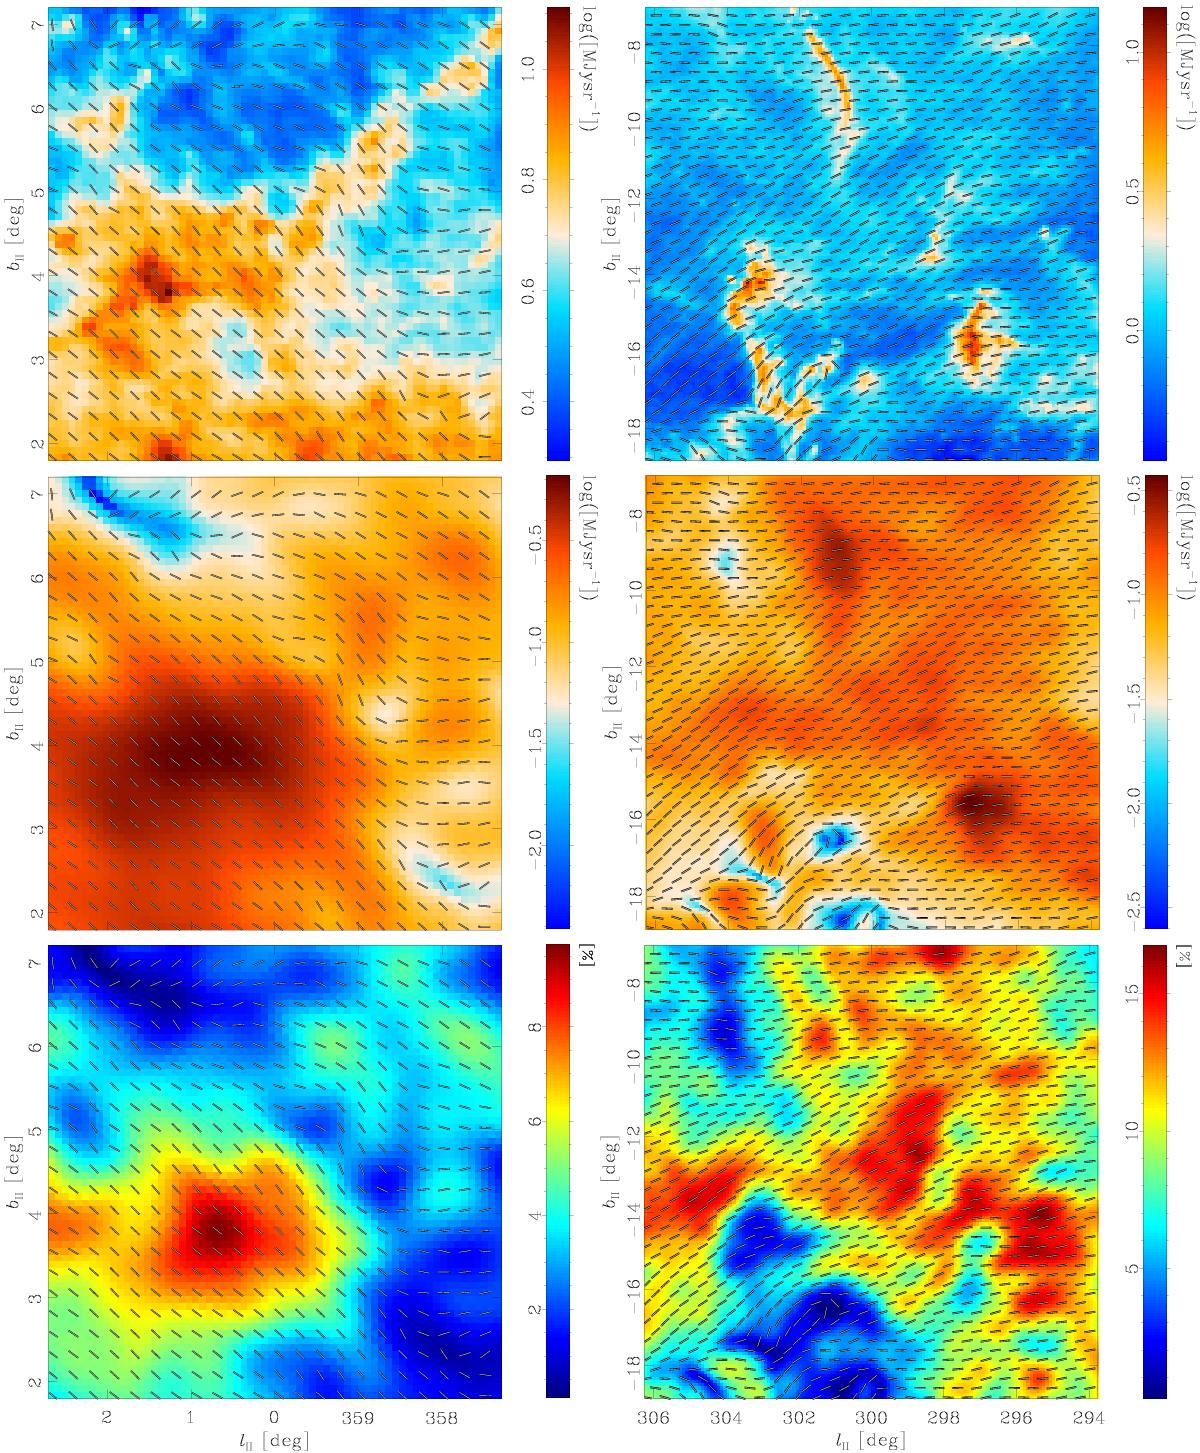
Maps of the total intensity (upper), polarized intensity (middle) and polarization fraction (lower) at 353 GHz for the Pipe Nebula (left column), and Chamaeleon-Musca (right column) regions. The total intensity map is shown at the full Planck resolution, while the polarization information is shown at a resolution of 30′. The polarization segments show the orientation of the apparent magnetic field, but their length is constant, not reflecting the changing polarization fraction. Note that the boundaries of the regions shown here do not match exactly those in Table 1 and Fig. 6.
Current usage metrics show cumulative count of Article Views (full-text article views including HTML views, PDF and ePub downloads, according to the available data) and Abstracts Views on Vision4Press platform.
Data correspond to usage on the plateform after 2015. The current usage metrics is available 48-96 hours after online publication and is updated daily on week days.
Initial download of the metrics may take a while.