Fig. 1
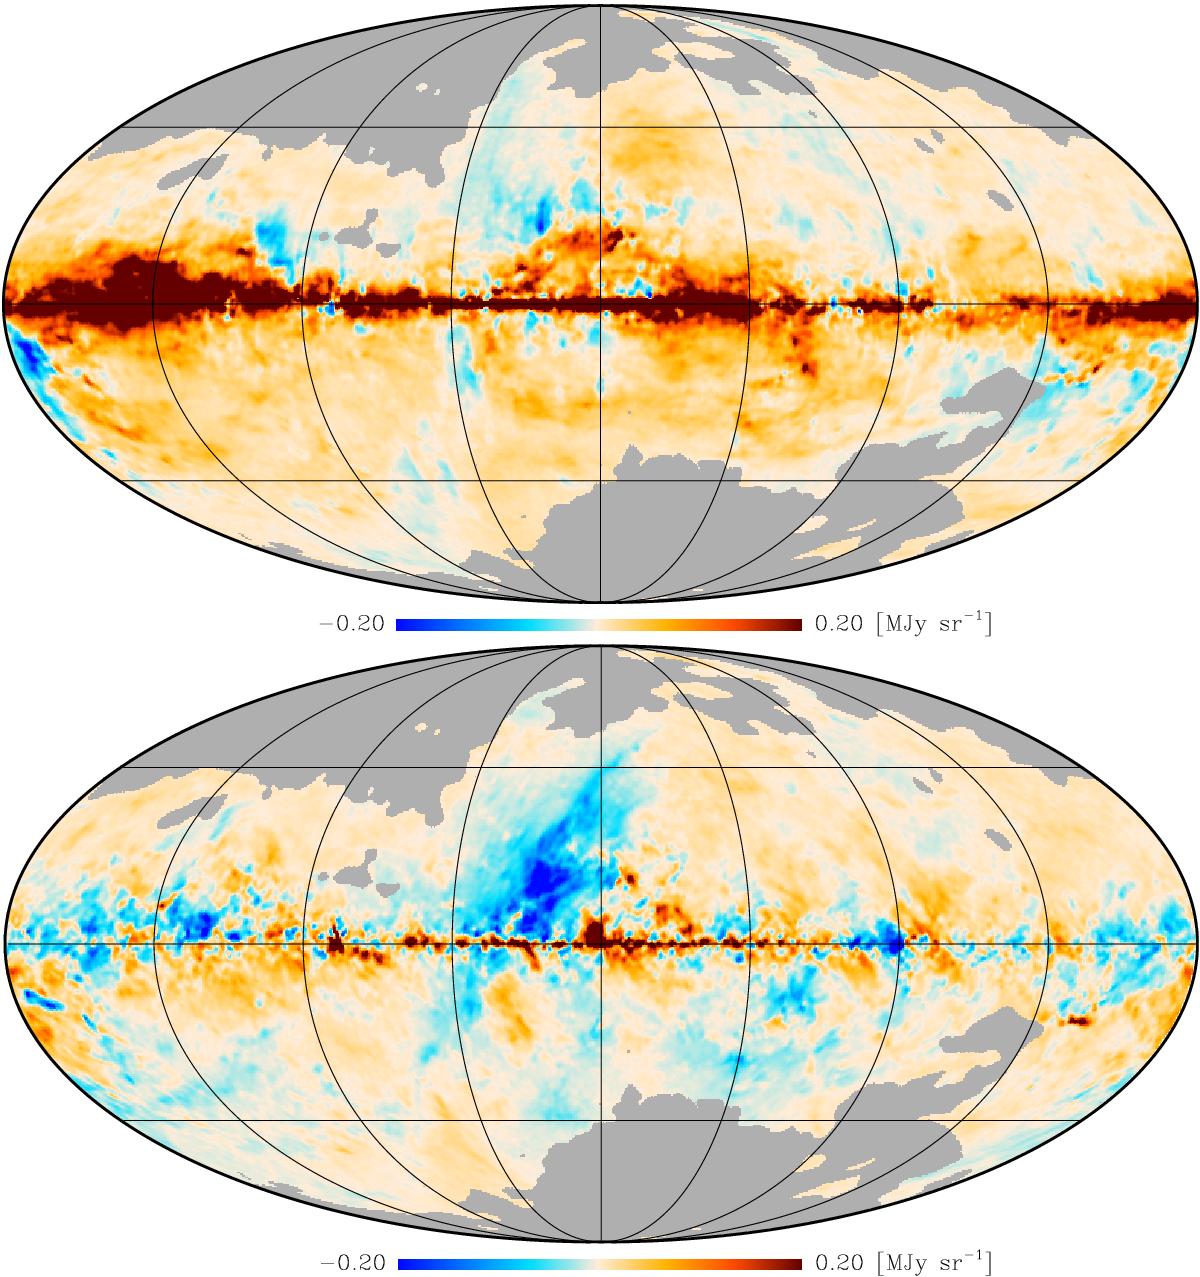
Planck 353 GHz polarization maps at 1° resolution. Upper: Q Stokes parameter map. Lower: U Stokes parameter map. The maps are shown with the same colour scale. High values are saturated to enhance mid-latitude structures. The values shown have been bias corrected as described in Sect. 2.3. These maps, as well as those in following figures, are shown in Galactic coordinates with the Galactic centre in the middle and longitude increasing to the left. The data are masked as described in Sect. 2.4.
Current usage metrics show cumulative count of Article Views (full-text article views including HTML views, PDF and ePub downloads, according to the available data) and Abstracts Views on Vision4Press platform.
Data correspond to usage on the plateform after 2015. The current usage metrics is available 48-96 hours after online publication and is updated daily on week days.
Initial download of the metrics may take a while.