Fig. 5
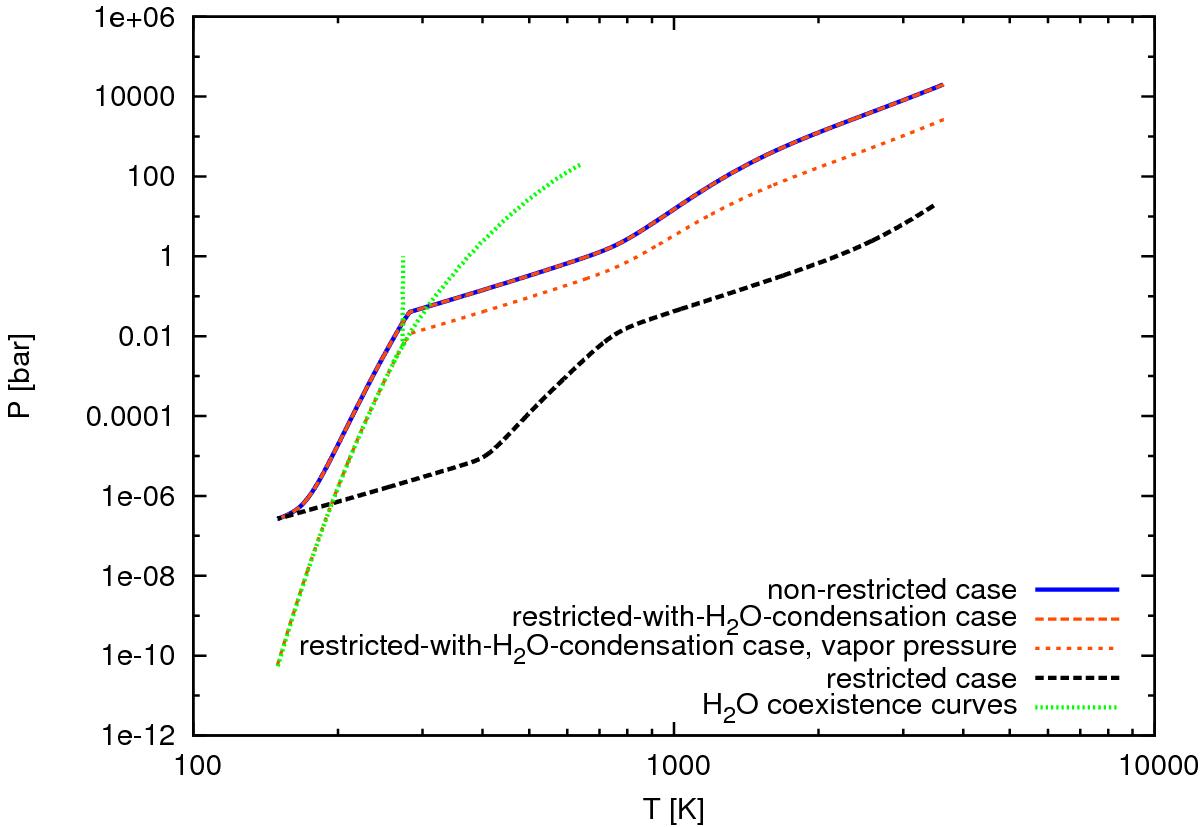
Pressure as a function of temperature for Z = 0.7 and MP = 0.29 M⊕. In the case where water is allowed to condense (orange lines), the vapour pressure follows the Clausius-Clapeyron curve until T = 282 K, which defines the loci where the vapour and liquid phases, and vapour and ice phases, can co-exist (green-dotted line). Hence, in these range of temperatures, water is being condensed, and the pressure-temperature profiles follow the moist adiabat.
Current usage metrics show cumulative count of Article Views (full-text article views including HTML views, PDF and ePub downloads, according to the available data) and Abstracts Views on Vision4Press platform.
Data correspond to usage on the plateform after 2015. The current usage metrics is available 48-96 hours after online publication and is updated daily on week days.
Initial download of the metrics may take a while.