Fig. 20
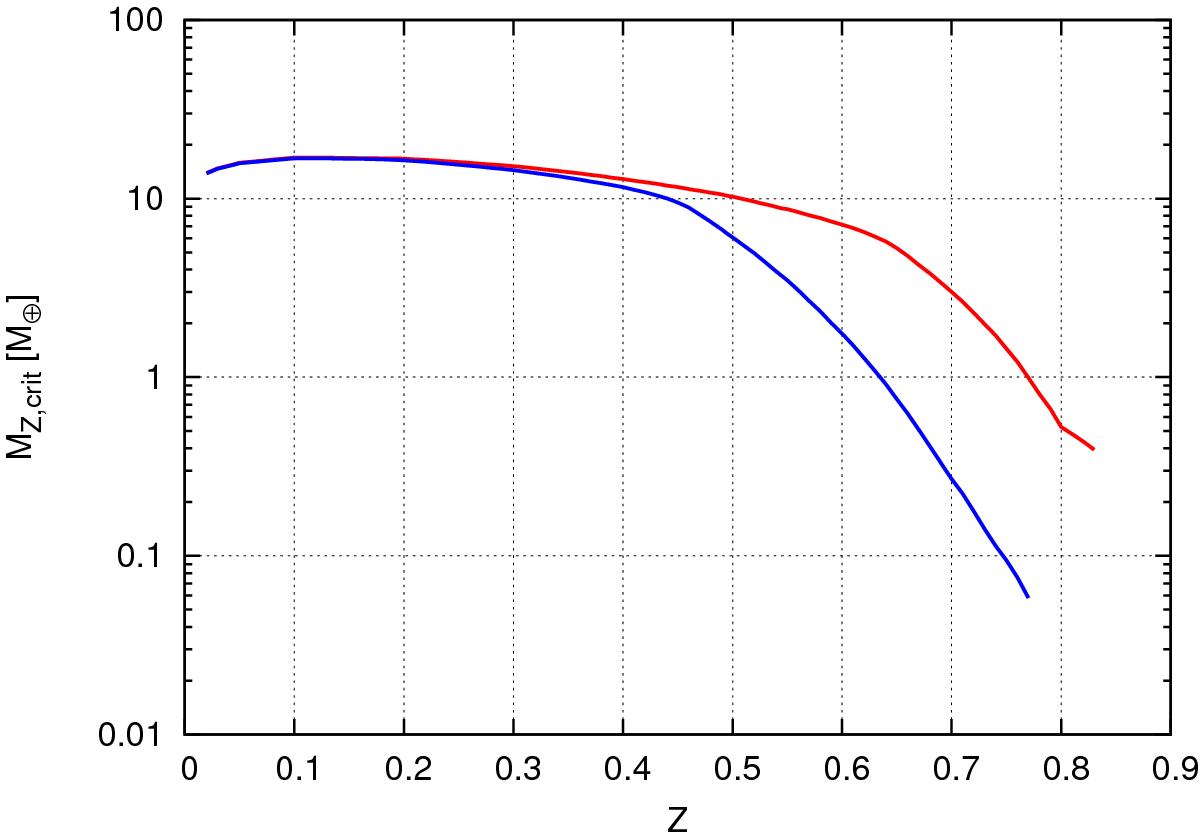
Critical mass of metals (mass content of metals in the planet when Mcore = Mcrit) as a function of metallicity. Red line: restricted case. Blue line: non-restricted case. Boundary conditions given by Table 1. Despite the similarity with Fig. 1, in this case the y-axis represents all the metal content of the planet at criticality, and not just that of the core. Depending on the slope of MZ,crit(Z), for the same planetesimal accretion rate, the planet could become sub- or super-critical. The steeper the slope (water condensation case), the more likely the structure is to become sub-critical, and therefore, to follow case 1 illustrated in Fig. 19.
Current usage metrics show cumulative count of Article Views (full-text article views including HTML views, PDF and ePub downloads, according to the available data) and Abstracts Views on Vision4Press platform.
Data correspond to usage on the plateform after 2015. The current usage metrics is available 48-96 hours after online publication and is updated daily on week days.
Initial download of the metrics may take a while.