Fig. 2
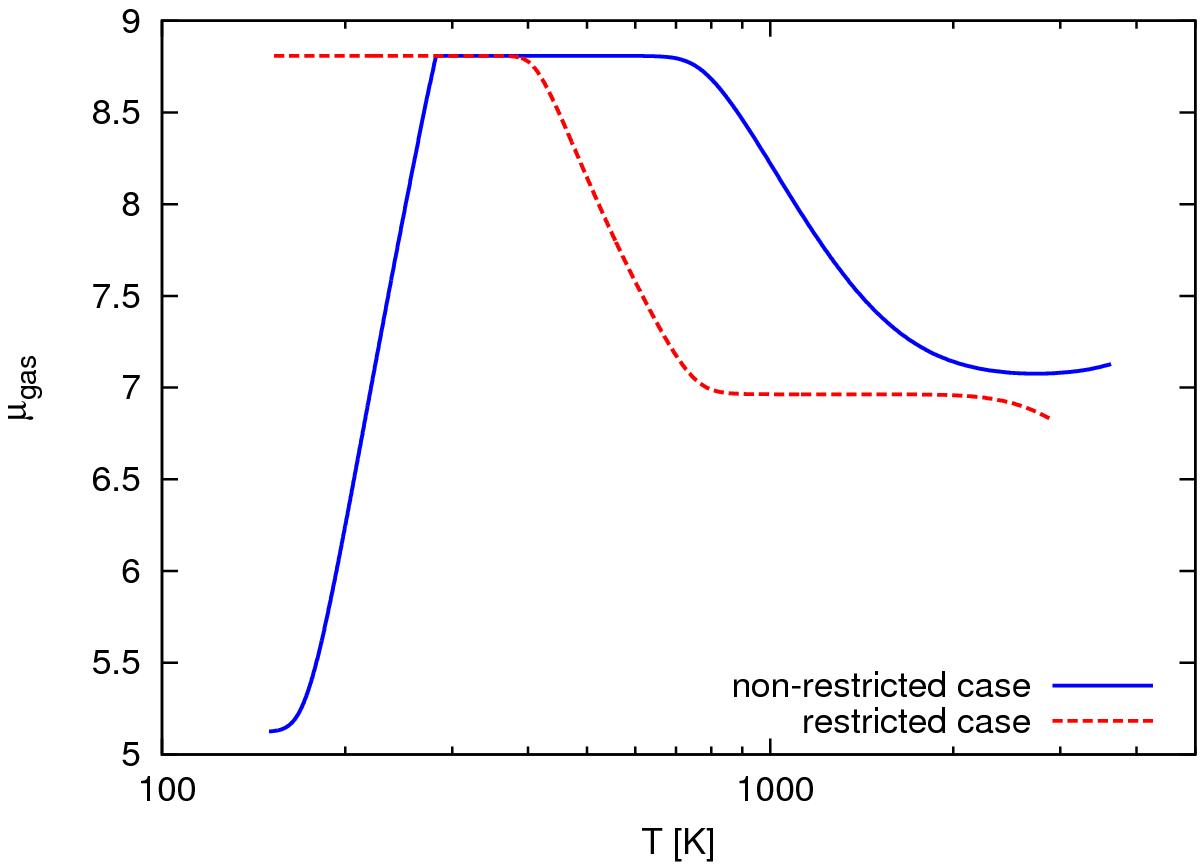
Profile of the gas mean molecular weight of the envelope as a function of its temperature for Z = 0.7 when Mcore = Mcrit,NR(Z = 0.7). Solid lines: non-restricted case. Dotted lines: restricted case. We note that in the the non-restricted case, μgas decreases in the outer layers (i.e. low temperature values; see main text). The difference between both profiles at high temperatures is a consequence of a difference in the pressure-temperature profiles (see Fig. 5).
Current usage metrics show cumulative count of Article Views (full-text article views including HTML views, PDF and ePub downloads, according to the available data) and Abstracts Views on Vision4Press platform.
Data correspond to usage on the plateform after 2015. The current usage metrics is available 48-96 hours after online publication and is updated daily on week days.
Initial download of the metrics may take a while.