Fig. 14
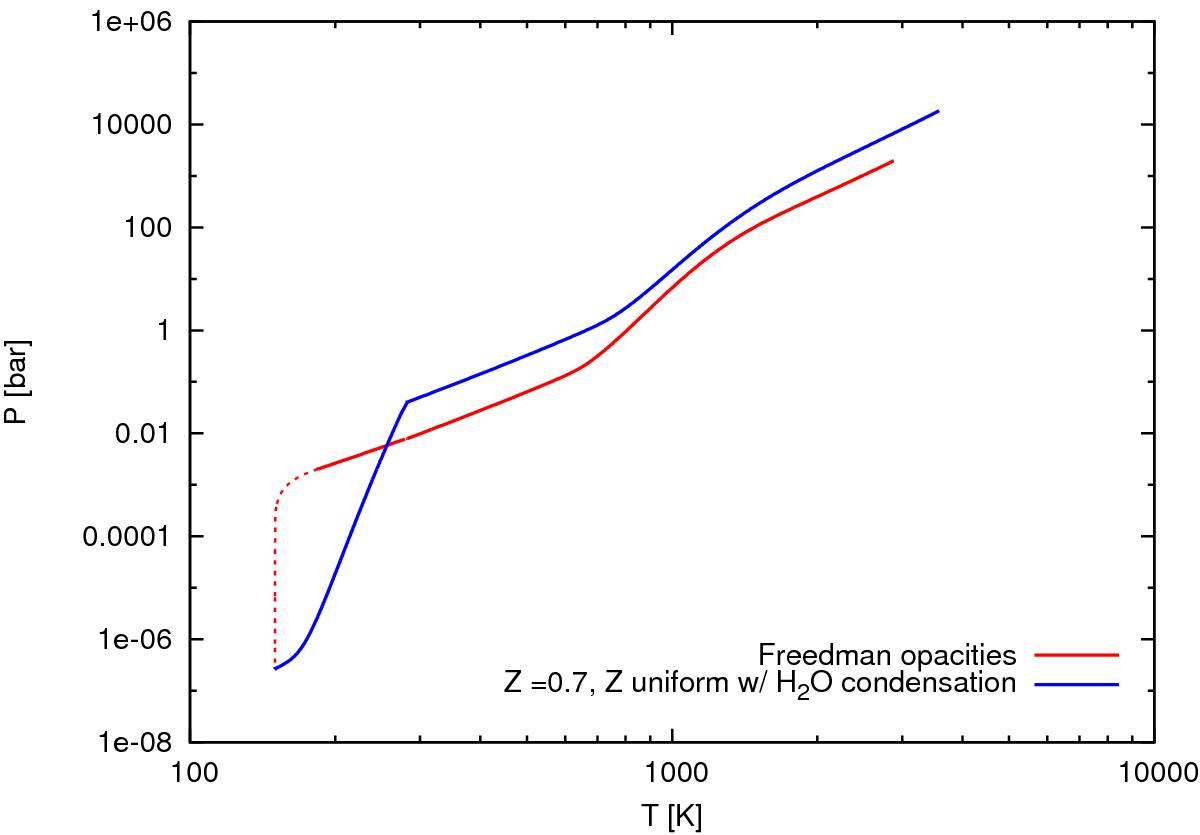
Red line: profile for two-layer atmosphere, but using Freedman opacities in the H–He region instead of the Ferguson opacities used in all other results of the paper. Blue line: Z = 0.7 (and uniform in the envelope) where water is allowed to condense. The resemblance of both profiles, compared to the restricted profile of Fig. 5, suggests that for the red curve the corresponding critical core mass will also be very low. Solid lines stand for convective regions and dotted for radiative ones.
Current usage metrics show cumulative count of Article Views (full-text article views including HTML views, PDF and ePub downloads, according to the available data) and Abstracts Views on Vision4Press platform.
Data correspond to usage on the plateform after 2015. The current usage metrics is available 48-96 hours after online publication and is updated daily on week days.
Initial download of the metrics may take a while.