Fig. 3
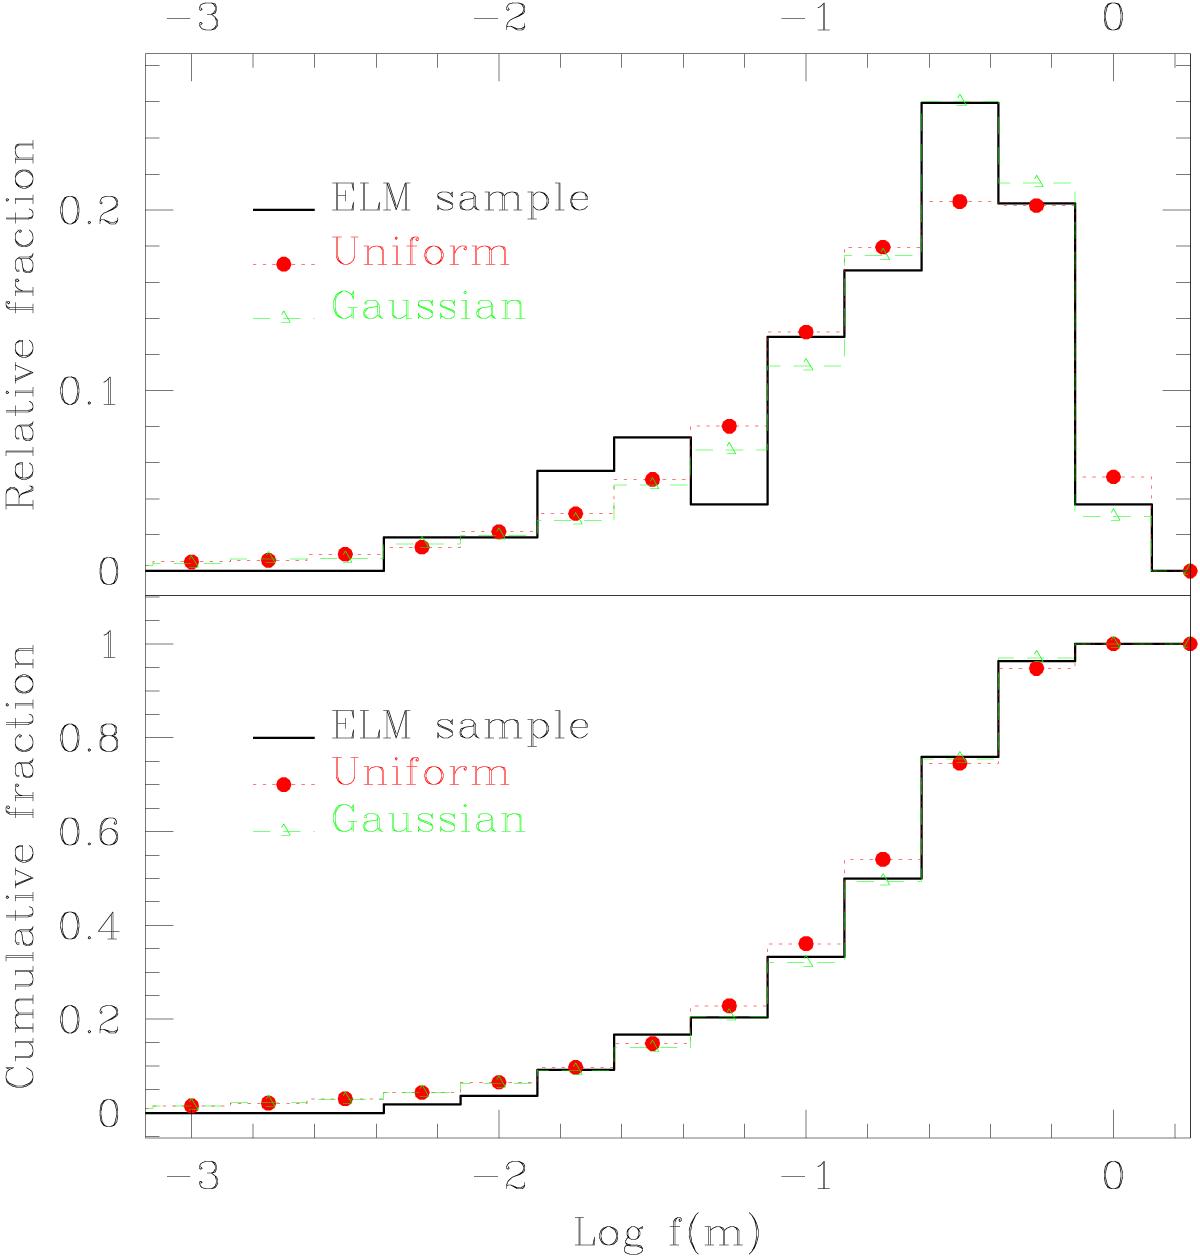
Comparison between the observed distribution of the logarithm of the spectroscopic mass function (solid black line) and the best fits for the uniformly distributed (red dotted line connected by heavy dots) and Gaussian-distributed (green dashed line connected by open squares) companion masses. For the former, I used M2,l = 0.25 M⊙ and M2,u = 1.28 M⊙, while for the latter, I used μ = 0.76 M⊙ and σ = 0.27 M⊙. The top panel shows the fraction of systems, while the bottom panel is the cumulative fraction of systems. It is clear that both samples are good fits, given the intrinsic errors of the observed distribution. (A colour version of the figure is available online.)
Current usage metrics show cumulative count of Article Views (full-text article views including HTML views, PDF and ePub downloads, according to the available data) and Abstracts Views on Vision4Press platform.
Data correspond to usage on the plateform after 2015. The current usage metrics is available 48-96 hours after online publication and is updated daily on week days.
Initial download of the metrics may take a while.