Fig. 2
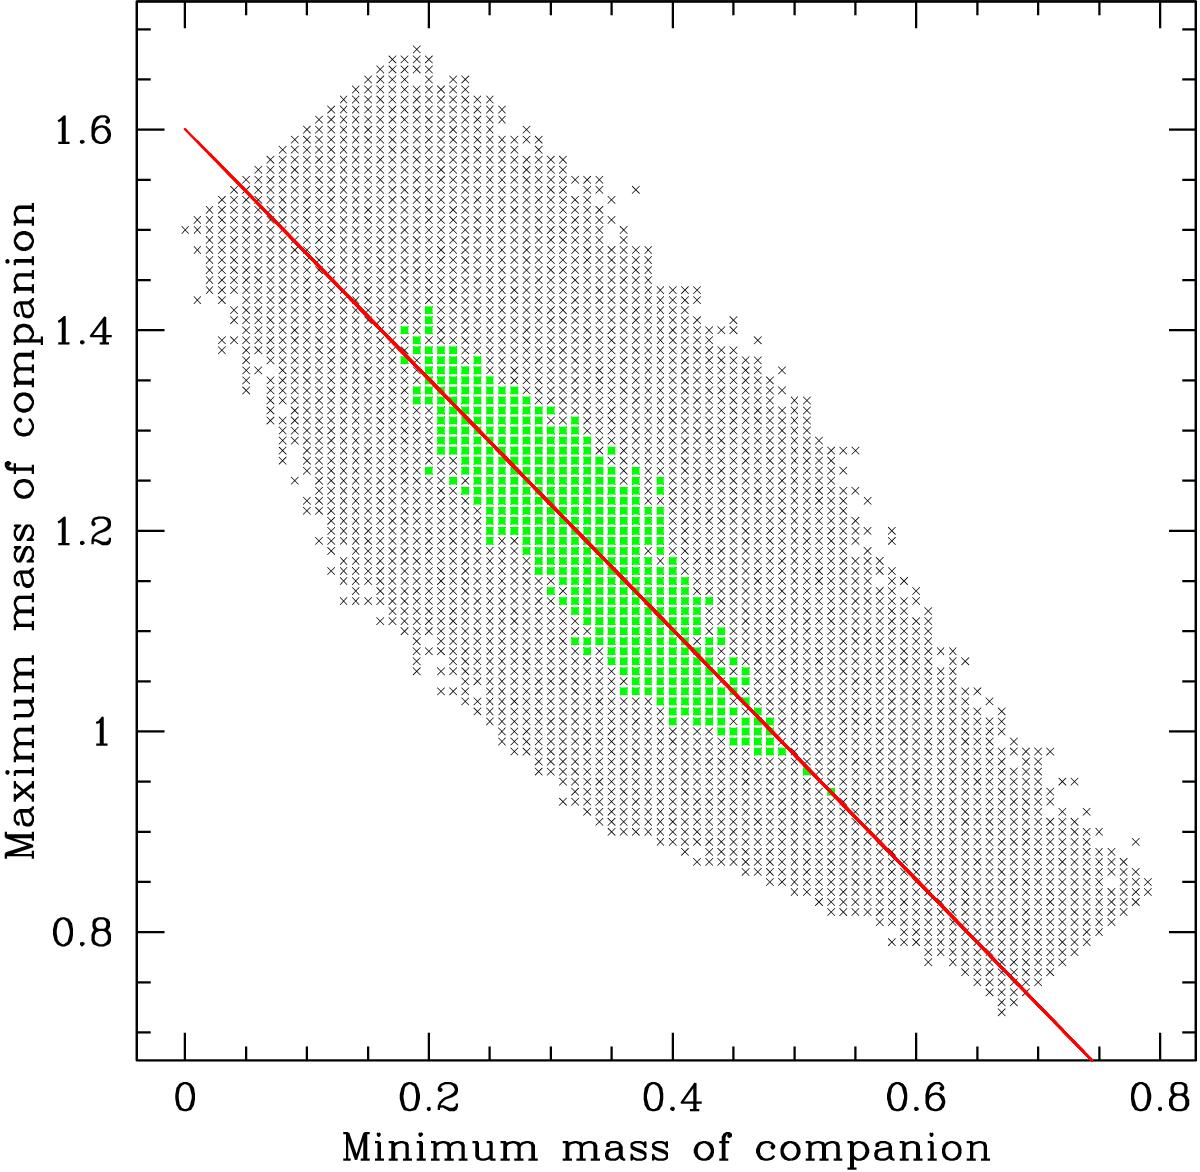
Highest mass of the companion as a function of the lowest mass of the companions for all simulated uniformly distributed samples that have D∗ < 0.1274 (in black) and those that have D∗ < 0.0506 (in green). The two masses are clearly correlated, and I show a linear fit to the green dots as the heavy, solid red line. (A colour version of the figure is available online.)
Current usage metrics show cumulative count of Article Views (full-text article views including HTML views, PDF and ePub downloads, according to the available data) and Abstracts Views on Vision4Press platform.
Data correspond to usage on the plateform after 2015. The current usage metrics is available 48-96 hours after online publication and is updated daily on week days.
Initial download of the metrics may take a while.