Fig. 1
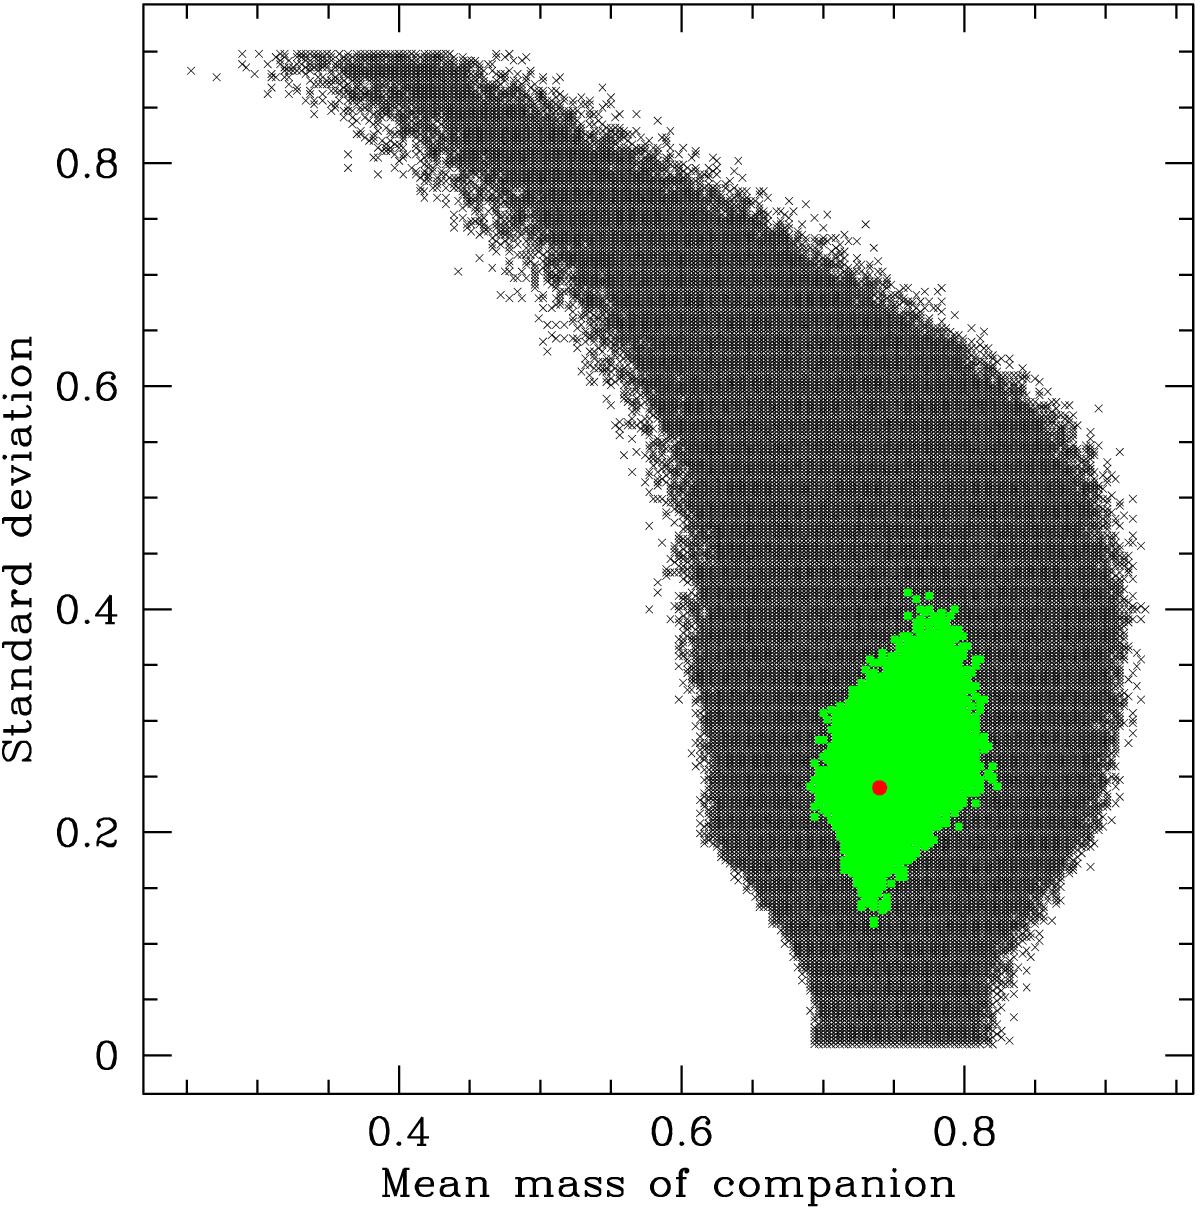
Standard deviation, σ, versus the mean mass of the companion, μ, for all simulated samples where the companion mass is distributed according to a Gaussian, and which have D∗ < 0.1274 (in black) and those that have D∗ < 0.0506 (in green). The heavy, red dot shows the location μ = 0.74, σ = 0.24. (A colour version of the figure is available online.)
Current usage metrics show cumulative count of Article Views (full-text article views including HTML views, PDF and ePub downloads, according to the available data) and Abstracts Views on Vision4Press platform.
Data correspond to usage on the plateform after 2015. The current usage metrics is available 48-96 hours after online publication and is updated daily on week days.
Initial download of the metrics may take a while.