Fig. 1
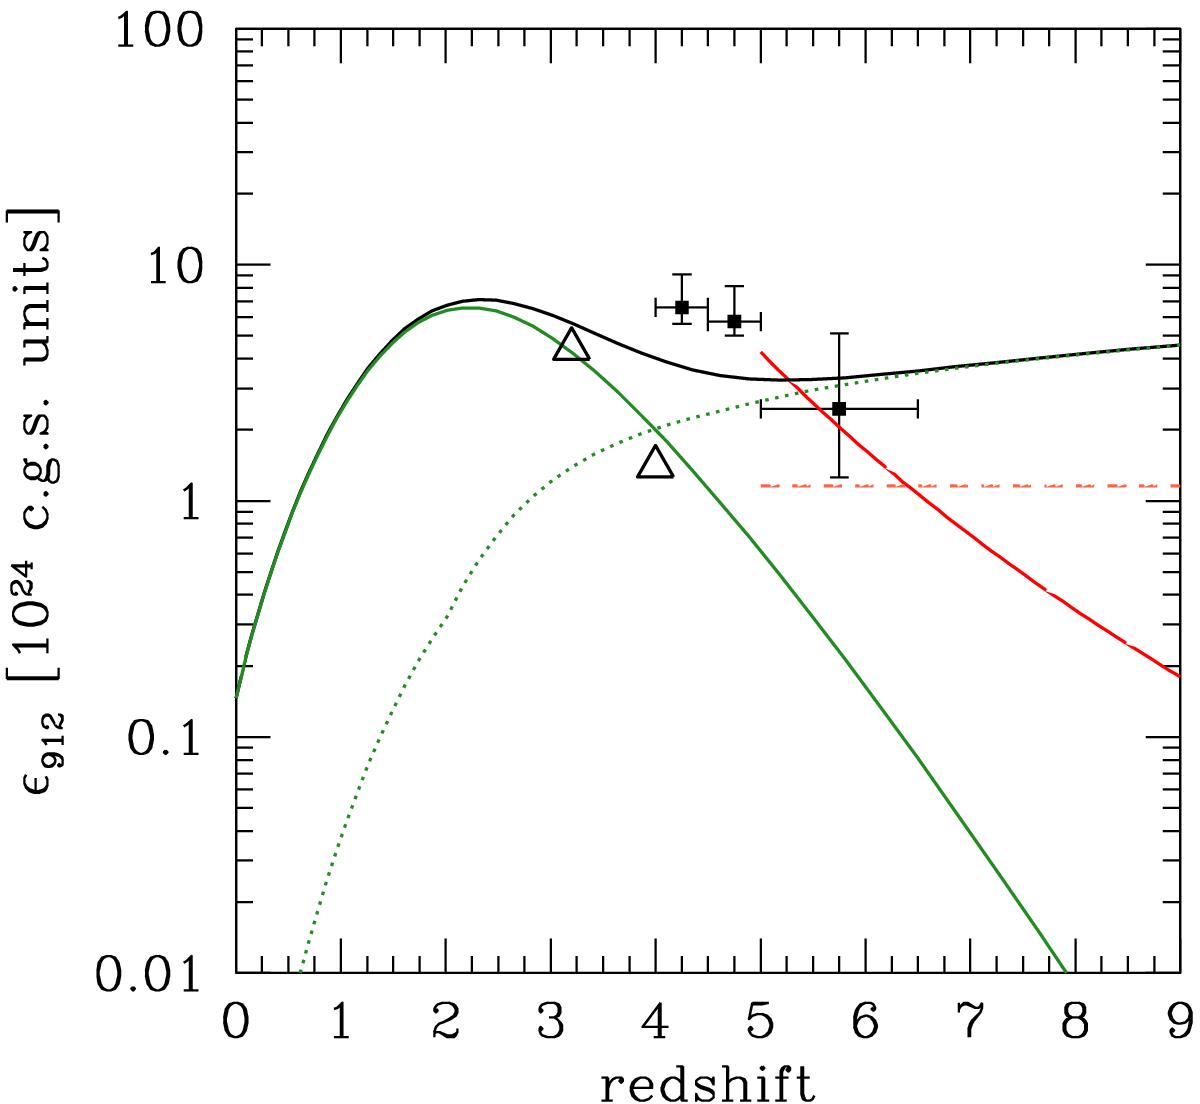
Highest emissivity at the H I Lyman limit vs. redshift. The red solid curve at z ≥ 5 is our benchmark case, consistent with the XRB limit ![]() erg cm-2 s-1 Hz-1 sr-1. This value accounts for sources at z ≲ 5 below the Chandra flux limit, estimated from the XRB synthesis model of Gilli et al. (2007). The dashed line shows the extreme case of a constant comoving redshift evolution of the AGN emissivity. The black line is the emissivity employed in the UV background model of Haardt & Madau (2012), with galaxies (dotted green line) and AGNs (solid green line) shown separately. The black data points are the AGN emissivity as estimated by Giallongo et al. (2015), while open triangles are data from Masters et al. (2012).
erg cm-2 s-1 Hz-1 sr-1. This value accounts for sources at z ≲ 5 below the Chandra flux limit, estimated from the XRB synthesis model of Gilli et al. (2007). The dashed line shows the extreme case of a constant comoving redshift evolution of the AGN emissivity. The black line is the emissivity employed in the UV background model of Haardt & Madau (2012), with galaxies (dotted green line) and AGNs (solid green line) shown separately. The black data points are the AGN emissivity as estimated by Giallongo et al. (2015), while open triangles are data from Masters et al. (2012).
Current usage metrics show cumulative count of Article Views (full-text article views including HTML views, PDF and ePub downloads, according to the available data) and Abstracts Views on Vision4Press platform.
Data correspond to usage on the plateform after 2015. The current usage metrics is available 48-96 hours after online publication and is updated daily on week days.
Initial download of the metrics may take a while.