Fig. 9
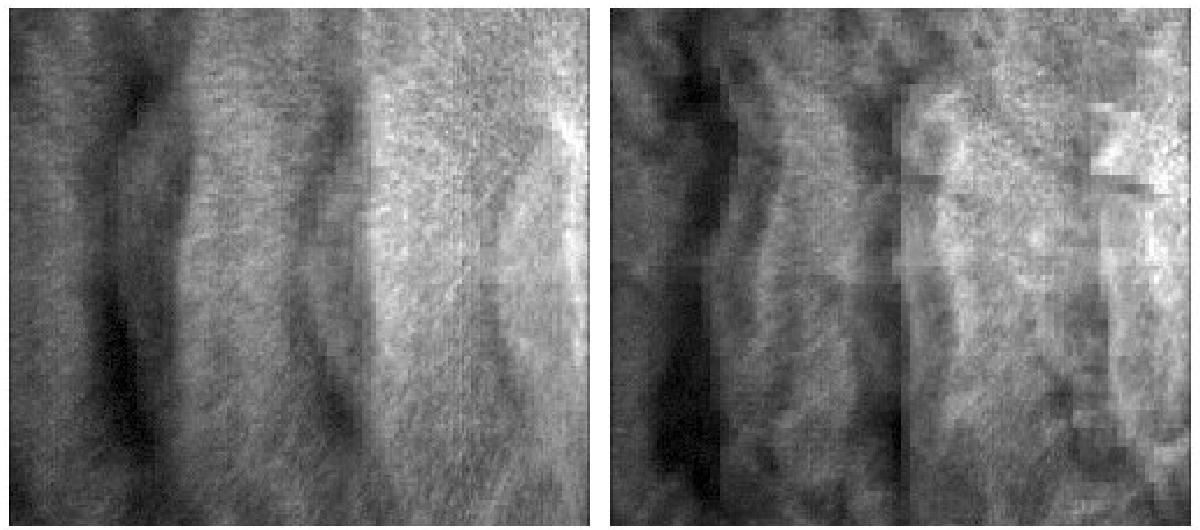
Synthetic observation of the KHI at 8.25 μm, with fixed observational angle β = 90° and α = 128° (cases E and G). Two different times are shown, left: t = 0.0084, right: t = 0.01 or 8.21 × 10⁴ and 9.78 × 10⁴ year, respectively). During this interval the development of small-scale perturbations in the nonlinear phase can be seen. A linear scale is used for the intensity of the images.
Current usage metrics show cumulative count of Article Views (full-text article views including HTML views, PDF and ePub downloads, according to the available data) and Abstracts Views on Vision4Press platform.
Data correspond to usage on the plateform after 2015. The current usage metrics is available 48-96 hours after online publication and is updated daily on week days.
Initial download of the metrics may take a while.