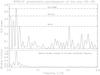
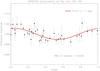
Fig. 6

Upper panel: the GLS periodogram of the XO-2N light curve collected by the APACHE survey and the corresponding window function, with the highest peak translated to the frequency of the best significant peak found in the periodogram. Levels of different FAP are also indicated. Lower panel: the APACHE light curve of XO-2N folded at the best period found by GLS with superposed the best sinusoidal fit of semi-amplitude A = 0.0027 mag (solid red line).
Current usage metrics show cumulative count of Article Views (full-text article views including HTML views, PDF and ePub downloads, according to the available data) and Abstracts Views on Vision4Press platform.
Data correspond to usage on the plateform after 2015. The current usage metrics is available 48-96 hours after online publication and is updated daily on week days.
Initial download of the metrics may take a while.