Fig. 5
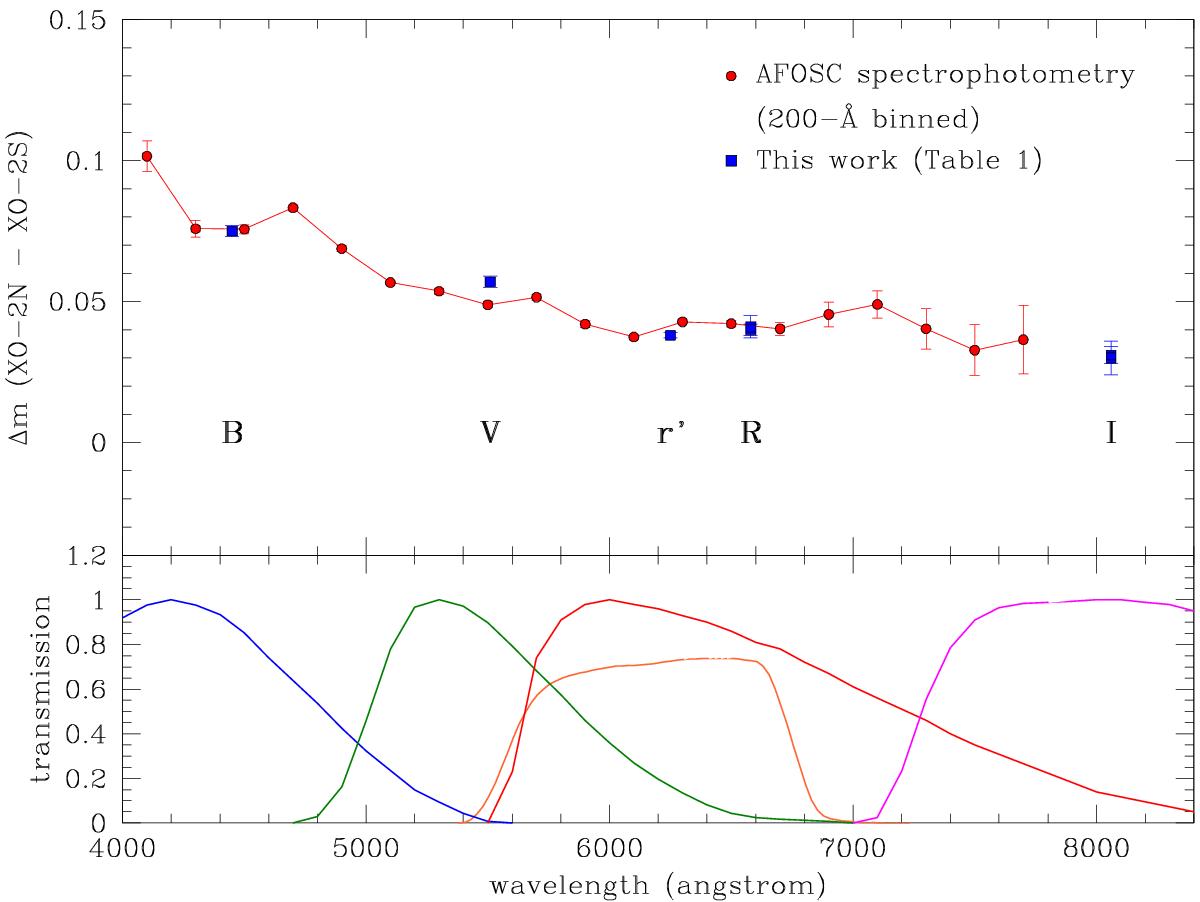
Upper panel: differential spectro-photometry of the XO-2 components obtained with the AFOSC camera at the 182 cm Asiago telescope. Red dots represent the mean values of measurements in bins of 200 Å, while blue squares indicate the broadband differential magnitudes presented in Table 1. Lower panel: bandpasses of the filters used for the broadband measurements.
Current usage metrics show cumulative count of Article Views (full-text article views including HTML views, PDF and ePub downloads, according to the available data) and Abstracts Views on Vision4Press platform.
Data correspond to usage on the plateform after 2015. The current usage metrics is available 48-96 hours after online publication and is updated daily on week days.
Initial download of the metrics may take a while.