Free Access
Fig. 15
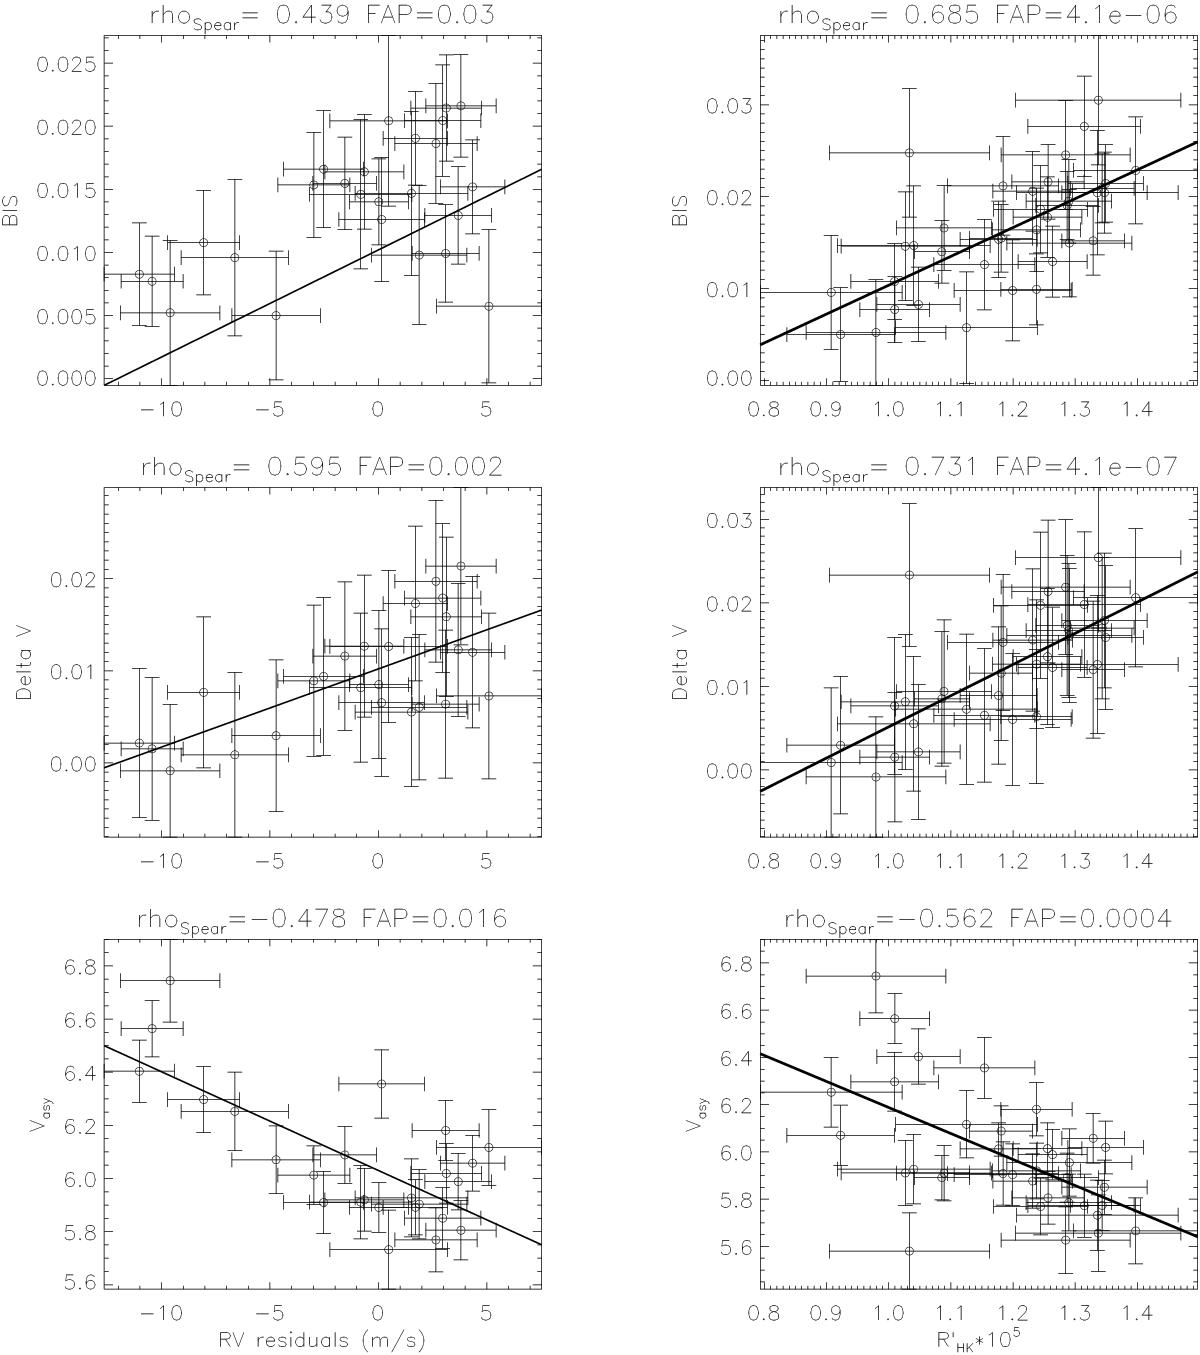
Correlations between the asymmetry indicators and the residuals of the radial velocities (left panel) for the star XO-2N, and between the same indicators and the activity index ![]() (right panel). We only considered values of
(right panel). We only considered values of ![]() extracted from spectra with S/N greater than 4 in the sixth order.
extracted from spectra with S/N greater than 4 in the sixth order.
Current usage metrics show cumulative count of Article Views (full-text article views including HTML views, PDF and ePub downloads, according to the available data) and Abstracts Views on Vision4Press platform.
Data correspond to usage on the plateform after 2015. The current usage metrics is available 48-96 hours after online publication and is updated daily on week days.
Initial download of the metrics may take a while.