Fig. 3
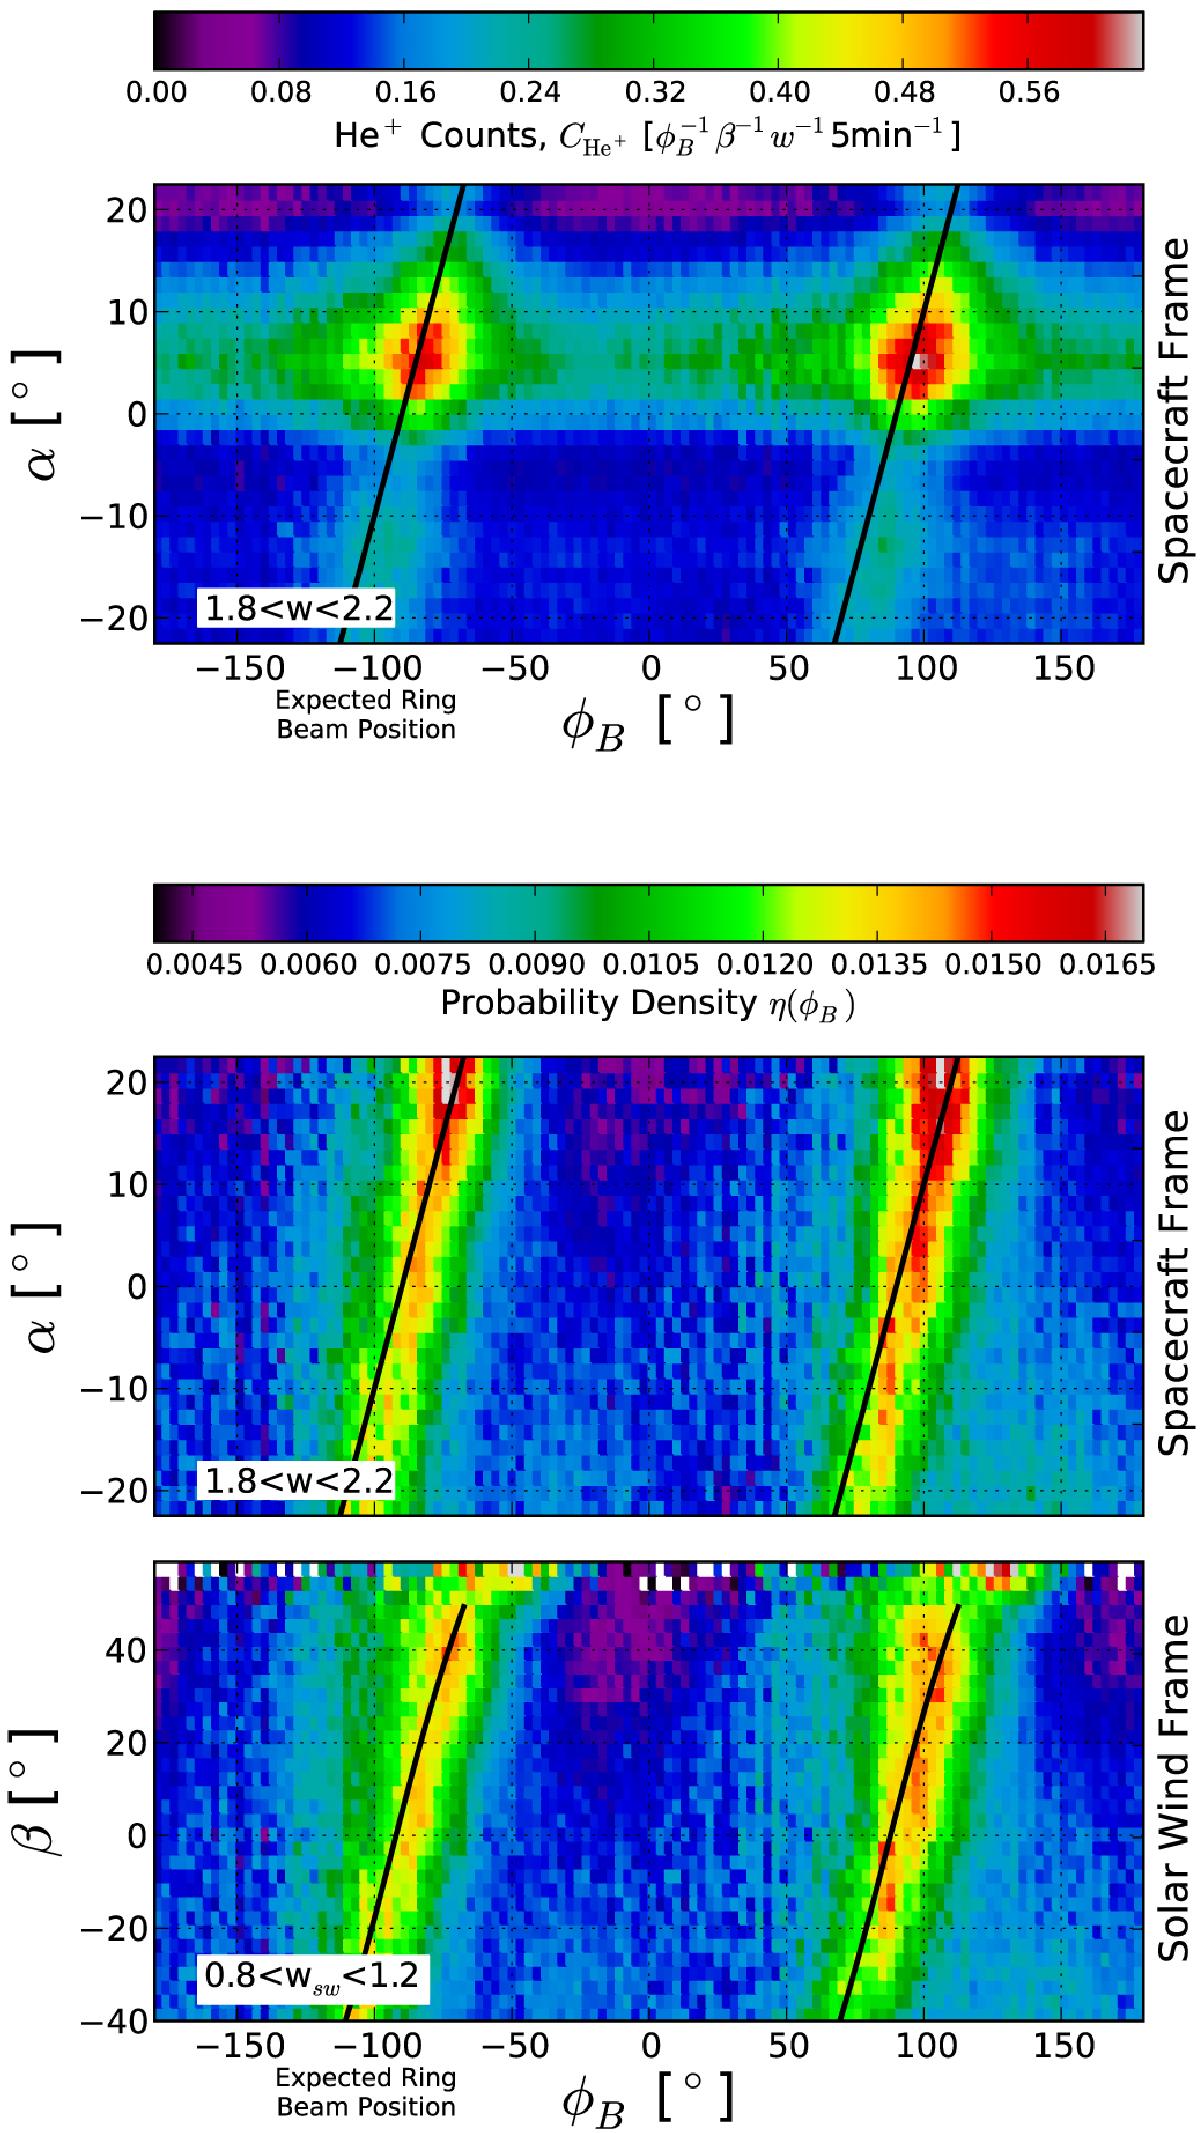
Top: average He+ counts observed per φ bin, α bin, and 5 min in a velocity range of 1.8 <w < 2.2 plotted as a function of φB (x-axis) and α (y-axis). Centre: probability density η(φB) plotted as a function of α and φB in a spacecraft frame of reference. Bottom: same as centre panel, except for He+ pickup ions with velocities of 0.8 <wsw < 1.2 coming from certain direction β in a solar wind frame of reference. The solid black lines denote the expected positions of the He+ ring beam distributions.
Current usage metrics show cumulative count of Article Views (full-text article views including HTML views, PDF and ePub downloads, according to the available data) and Abstracts Views on Vision4Press platform.
Data correspond to usage on the plateform after 2015. The current usage metrics is available 48-96 hours after online publication and is updated daily on week days.
Initial download of the metrics may take a while.