Fig. 14
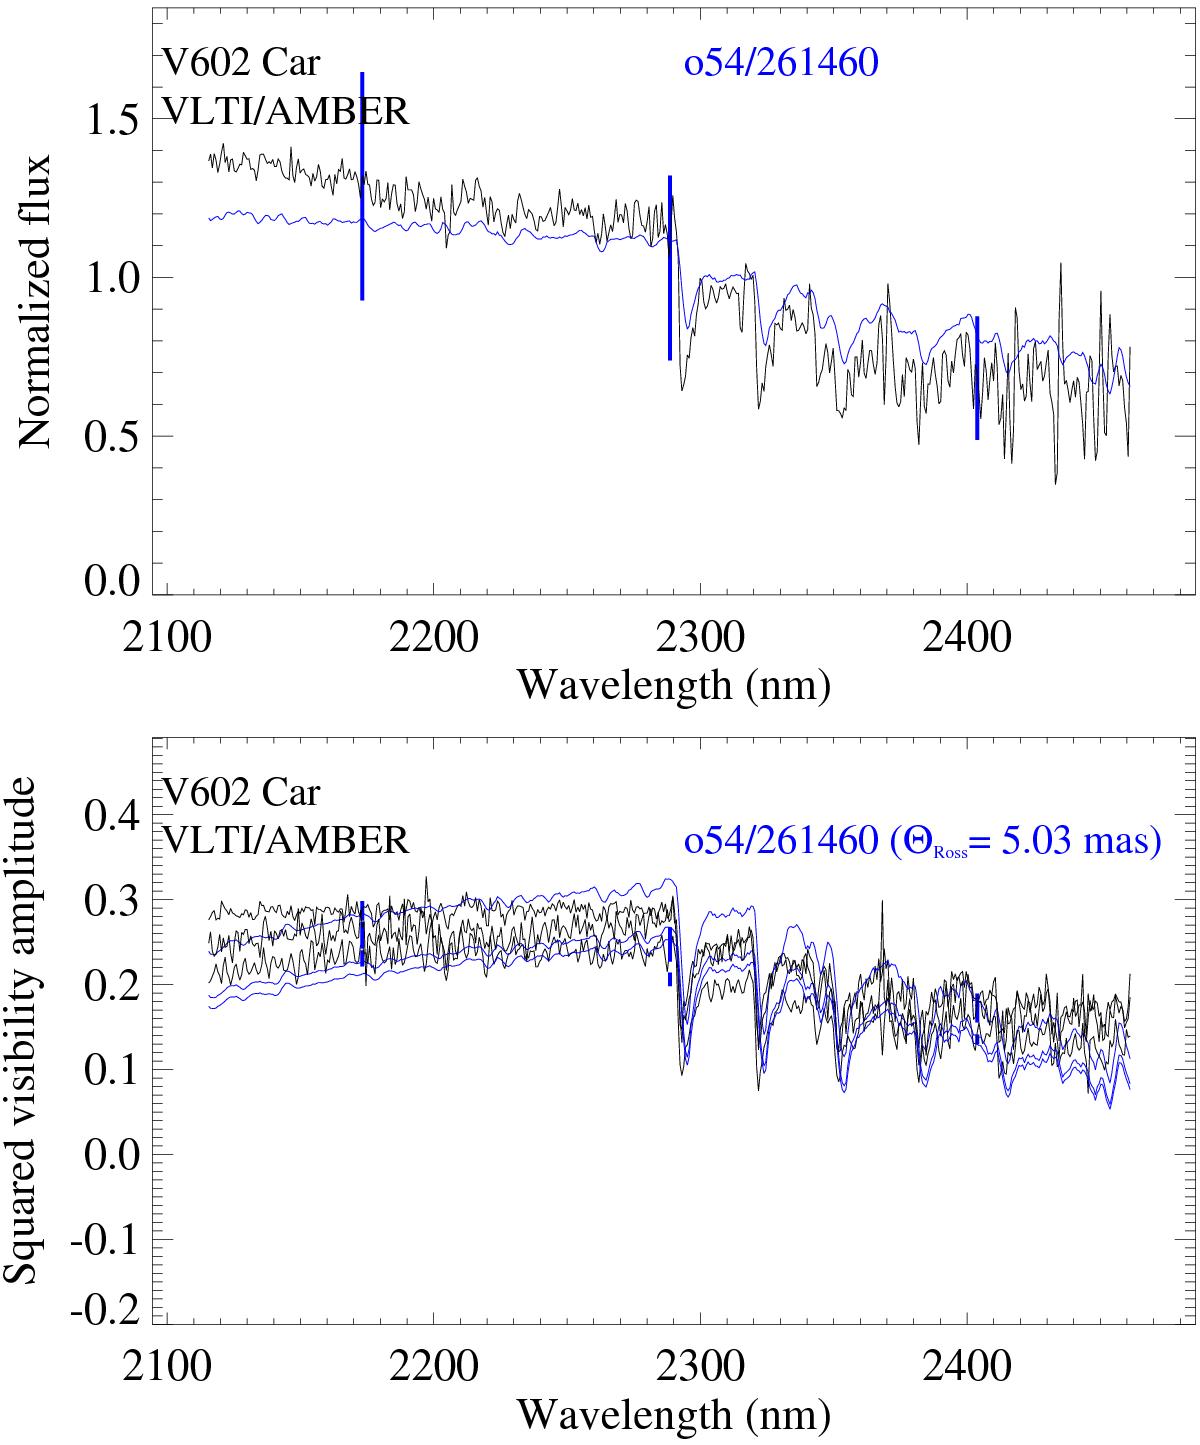
Observed normalized flux (top) and squared visibility amplitudes (bottom) of our V602 Car from Fig. 1, compared to one of the best-fit CODEX model atmospheres. The black lines denote the observational data, and the blue lines the model predictions for all three baselines (bottom). The model parameters are listed in the main text. The thick vertical lines indicate the uncertainties at three wavelength intervals.
Current usage metrics show cumulative count of Article Views (full-text article views including HTML views, PDF and ePub downloads, according to the available data) and Abstracts Views on Vision4Press platform.
Data correspond to usage on the plateform after 2015. The current usage metrics is available 48-96 hours after online publication and is updated daily on week days.
Initial download of the metrics may take a while.