Fig. 13
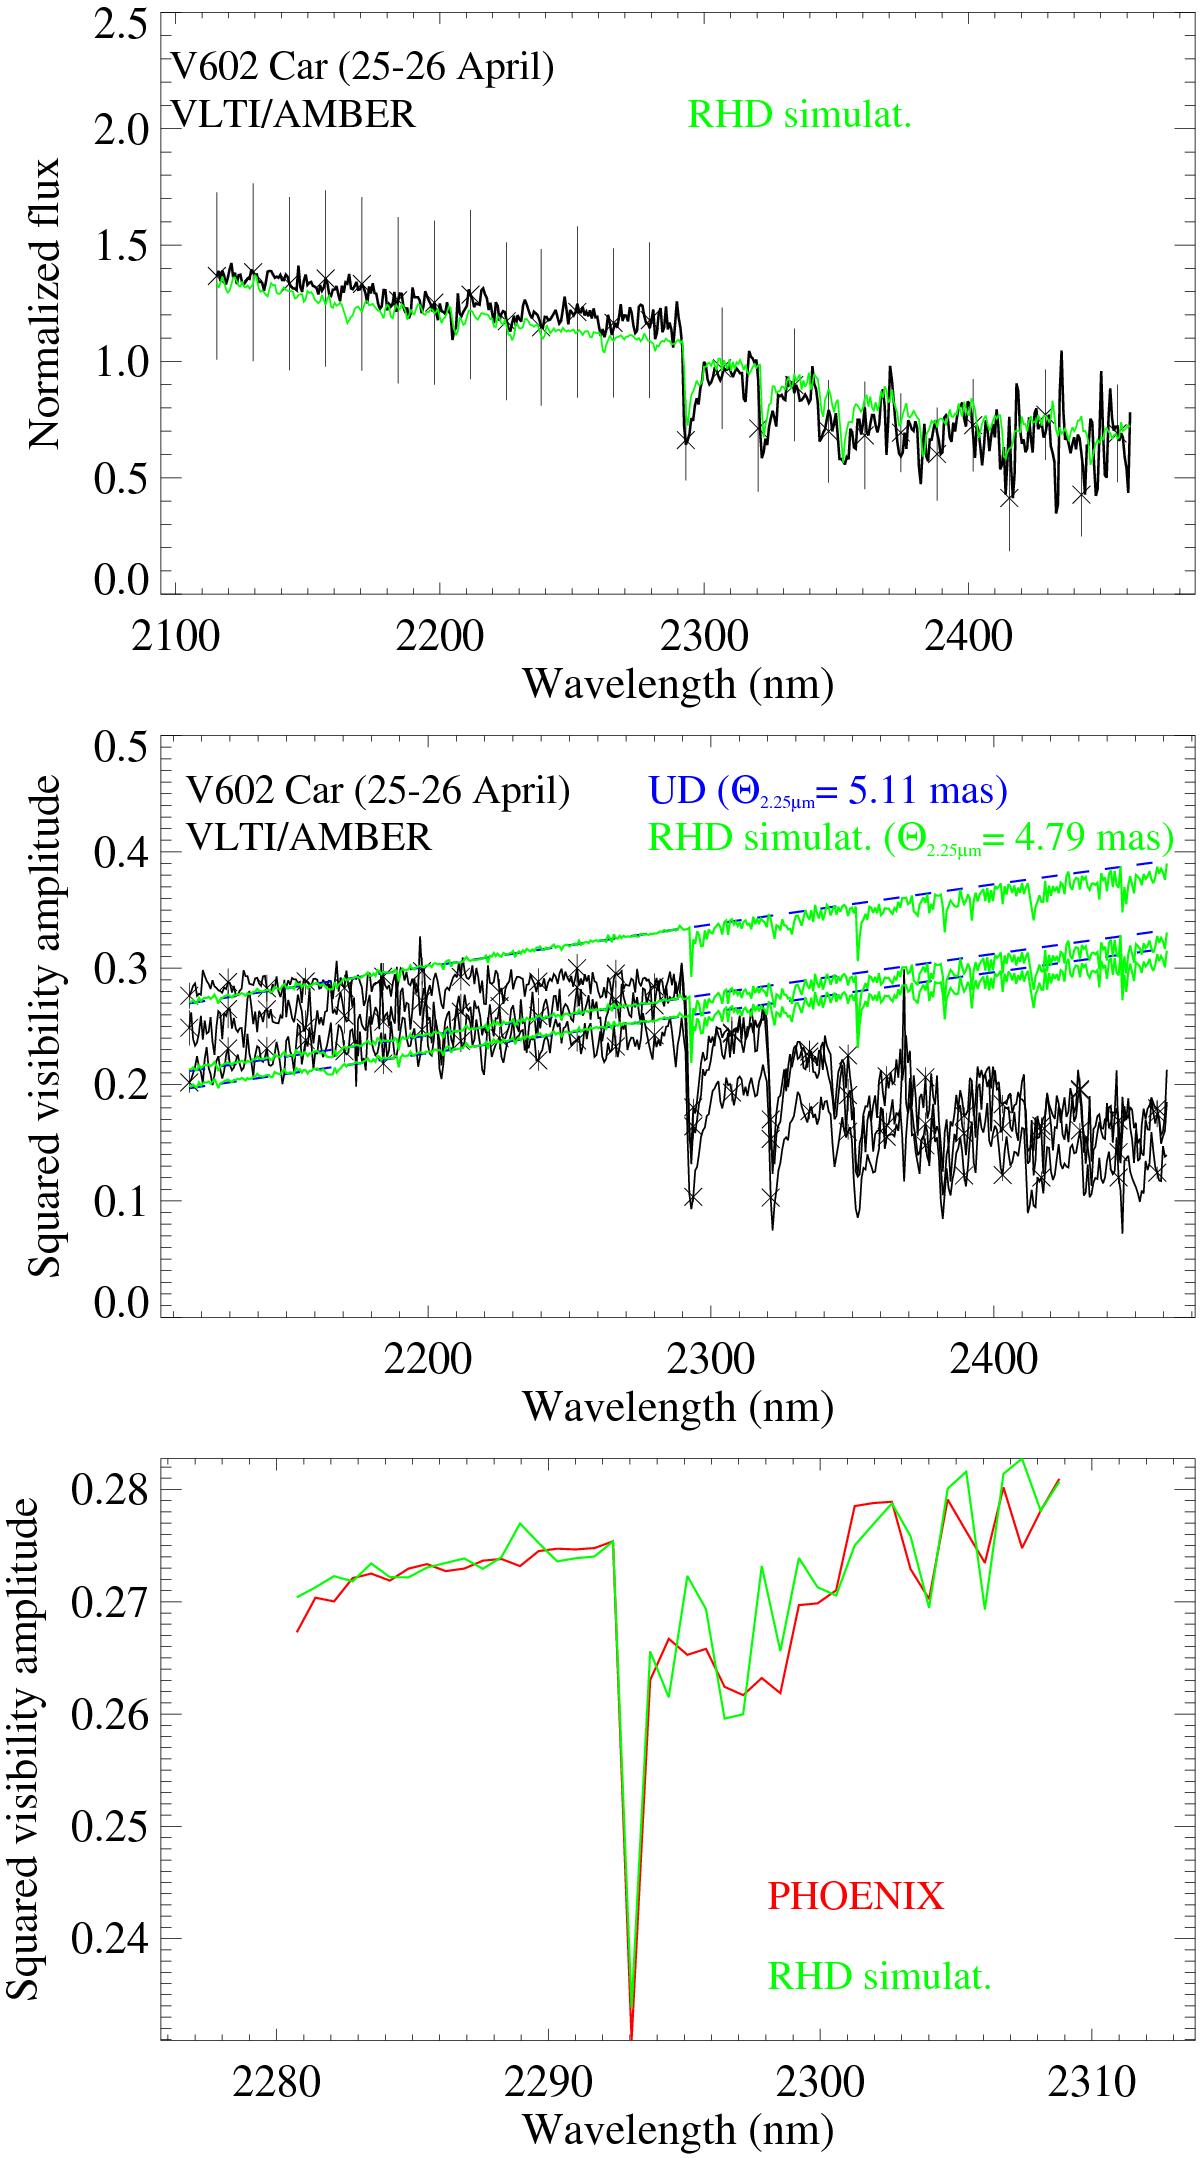
Observed normalized flux (top), square visibility amplitudes (middle) of V602 Car as in Fig. 1, compared to the prediction by the 3D RHD simulations of Fig. 12. The black curves are the observational data, the green curve the RHD simulation, and the blue curve the best-fit UD model (it is underplotted to the green curve). Bottom: enlargement of the synthetic squared visibility amplitudes of the CO (2−0) line (2.294 μm) predicted by the PHOENIX model atmosphere that best fits our V602 Car data (cf. Fig. 1) compared to the prediction by the RHD simulation of Fig. 12. The stellar parameters of the PHOENIX mode are Teff = 3400 K, log (g) = −0.5, M = 20 M⊙. Those of the RHD simulation are Teff = 3487 K, log (g) = −0.335, R = 830 R⊙, M = 12 M⊙.
Current usage metrics show cumulative count of Article Views (full-text article views including HTML views, PDF and ePub downloads, according to the available data) and Abstracts Views on Vision4Press platform.
Data correspond to usage on the plateform after 2015. The current usage metrics is available 48-96 hours after online publication and is updated daily on week days.
Initial download of the metrics may take a while.