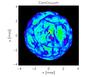
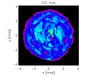
Fig. 12
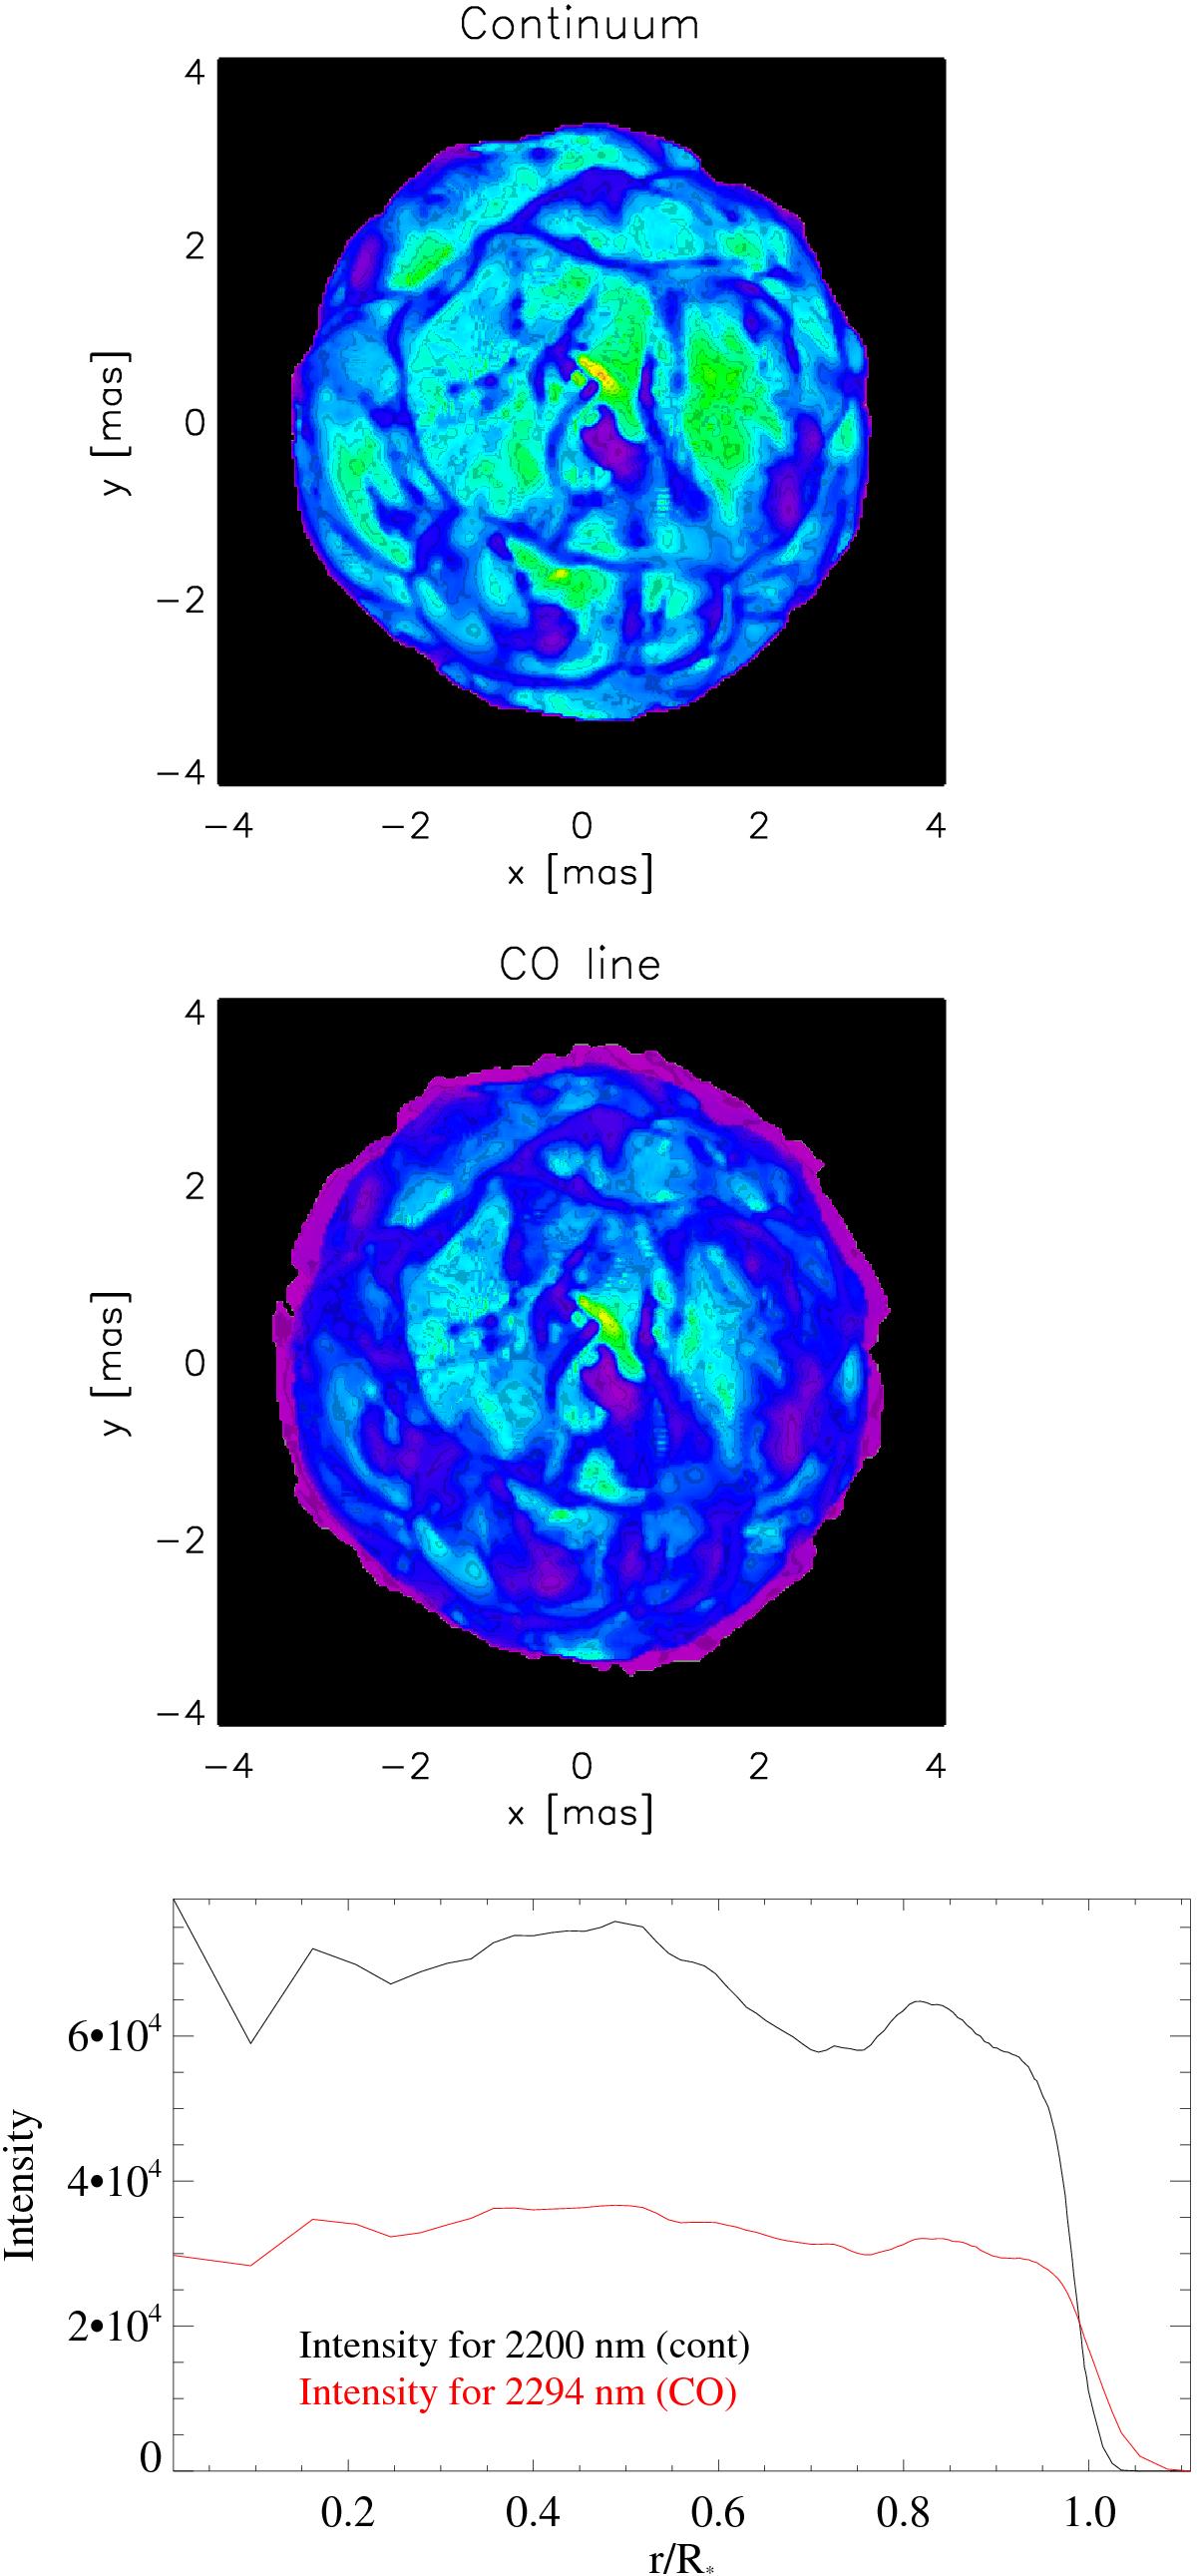
3D radiative-hydrodynamical (RHD) simulations of convection for one snapshot of model st35gm03n07 (see Table 5). Top: image of the intensity at a continuum wavelength of 2.20 μm. Middle: image of the intensity at the CO (2−0) line at 2.294 μm. Bottom: azimuthally averaged intensity profiles of both images, where the black line denotes the continuum wavelength and the red line denotes the CO line. The radii is defined by ![]() (μ is explained in the text).
(μ is explained in the text).
Current usage metrics show cumulative count of Article Views (full-text article views including HTML views, PDF and ePub downloads, according to the available data) and Abstracts Views on Vision4Press platform.
Data correspond to usage on the plateform after 2015. The current usage metrics is available 48-96 hours after online publication and is updated daily on week days.
Initial download of the metrics may take a while.