Fig. 11
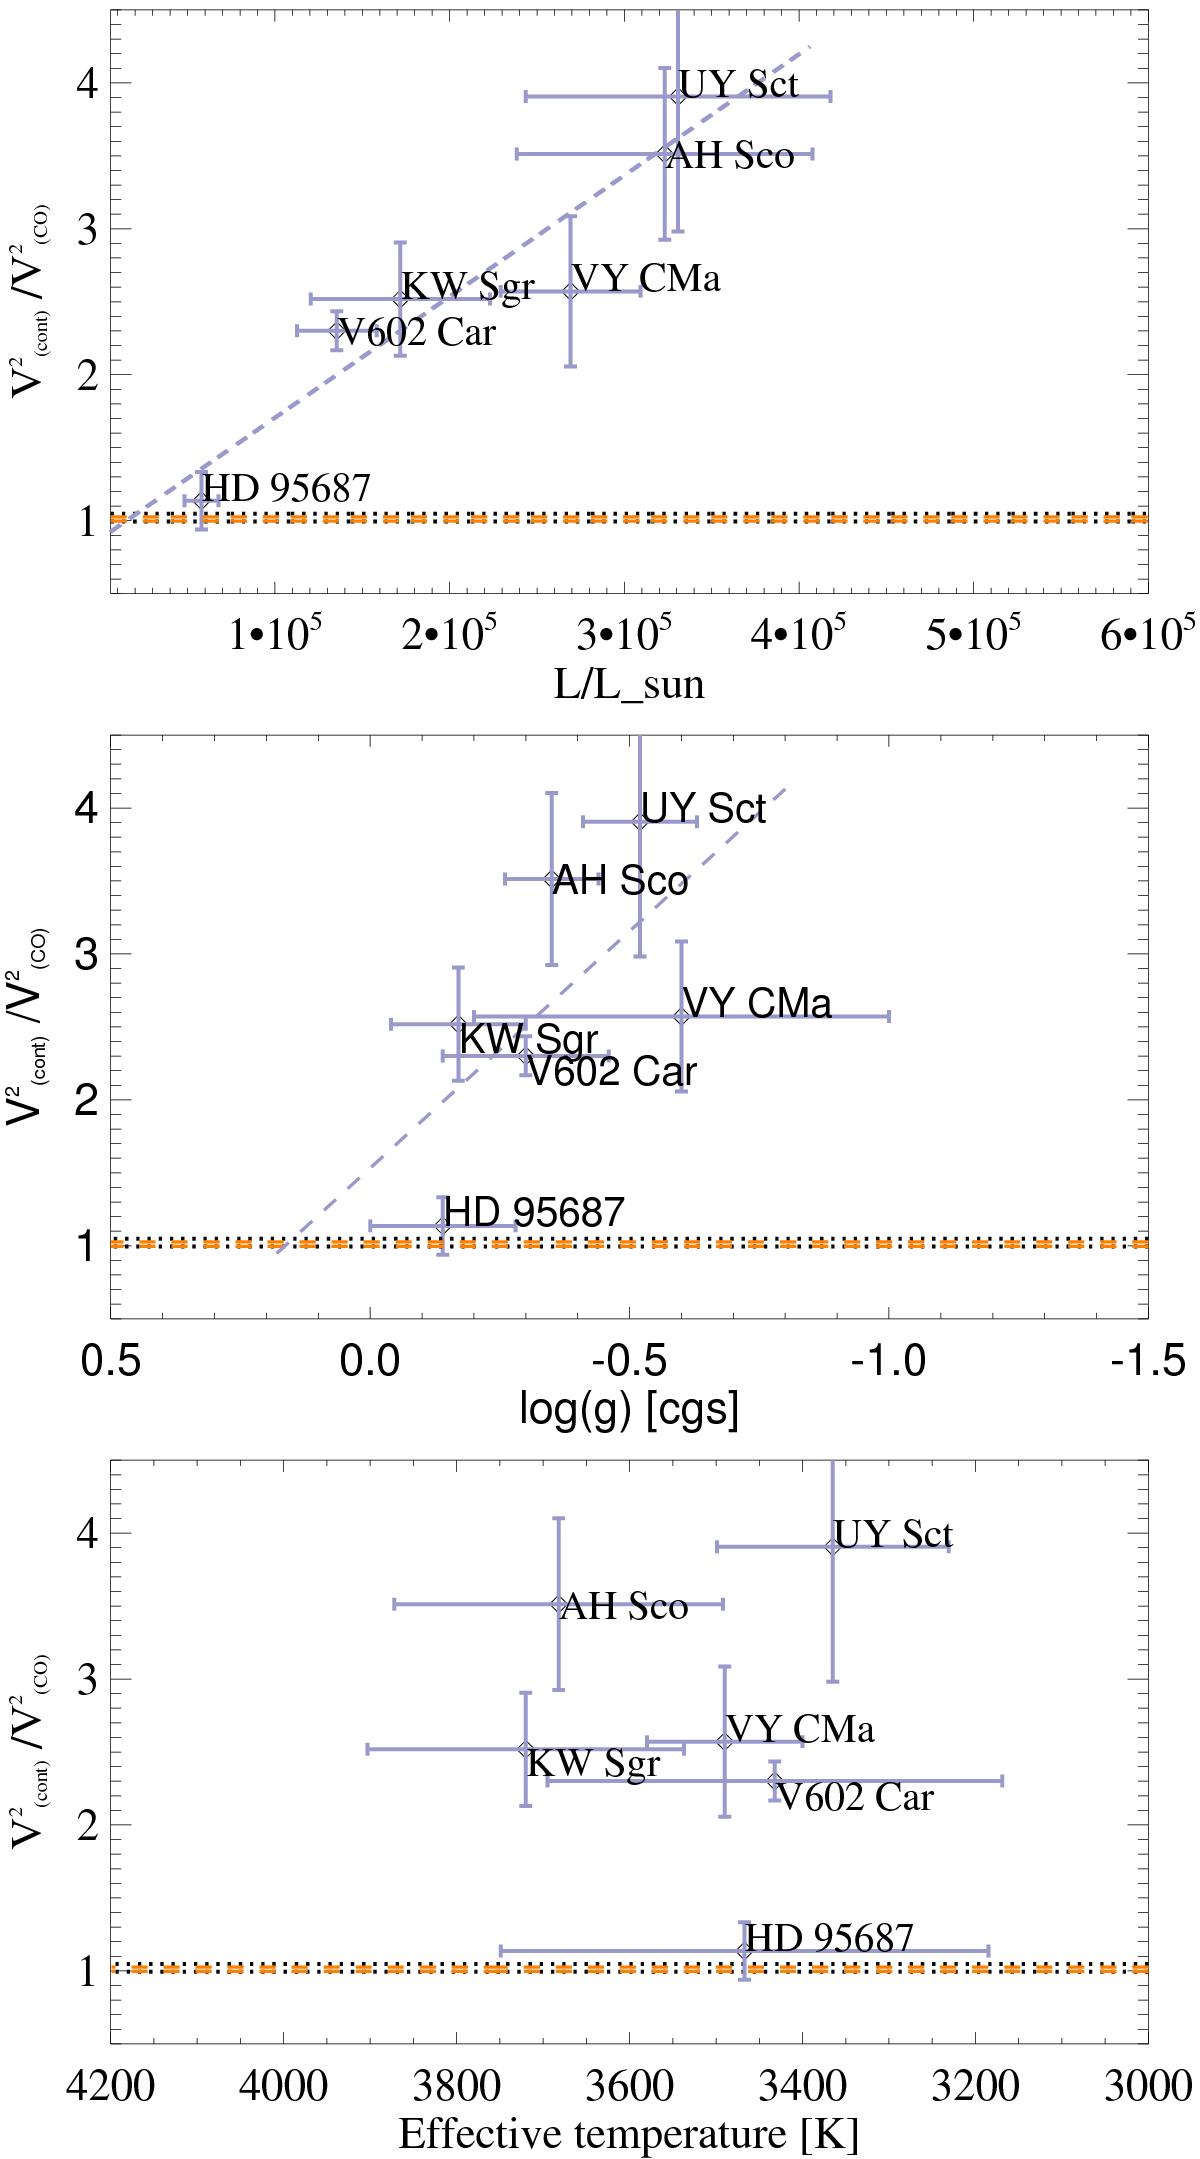
Ratio between the square visibility in the continuum (average between 2.27 and 2.28 μm) and the square visibility in the CO (2−0) line vs. log(L/L⊙) (top), log(g) (middle), and the effective temperature (bottom) for the sample of RSGs (Arroyo-Torres et al. 2013; Wittkowski et al. 2012; this work). The dotted black lines show the range of predictions by the best-fit PHOENIX model of these sources, and the dashed orange the range of predictions by the best-fit RHD simulation. Both lines are overlap. The dashed gray lines, in the top and middle, show linear fits.
Current usage metrics show cumulative count of Article Views (full-text article views including HTML views, PDF and ePub downloads, according to the available data) and Abstracts Views on Vision4Press platform.
Data correspond to usage on the plateform after 2015. The current usage metrics is available 48-96 hours after online publication and is updated daily on week days.
Initial download of the metrics may take a while.