Fig. 9
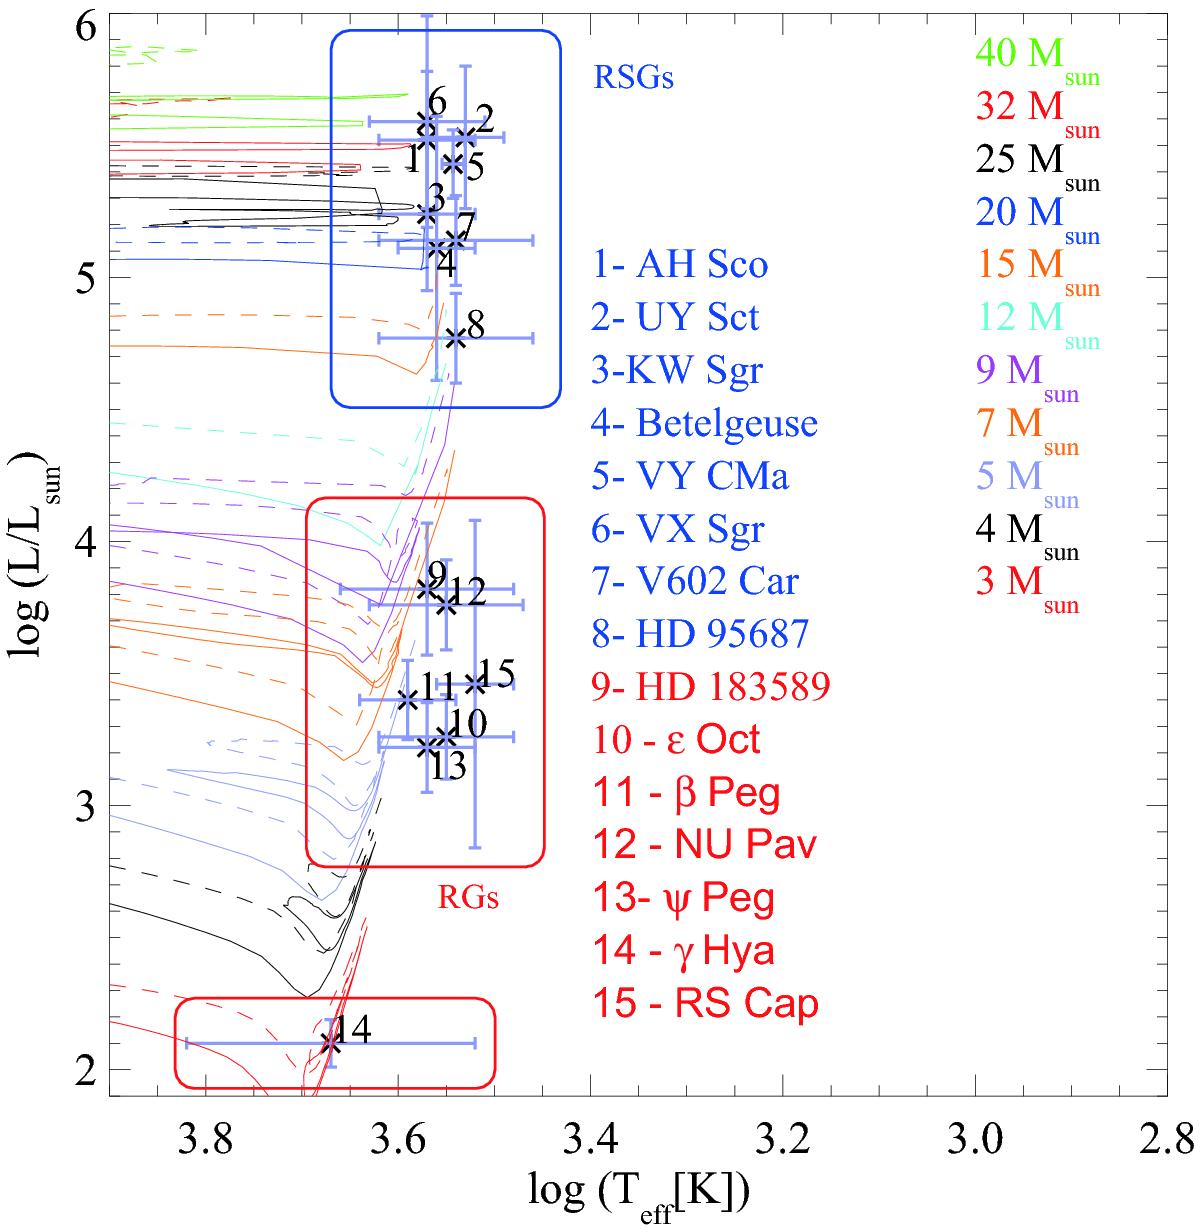
Location of our sources in the HR diagram, compared to evolutionary tracks from Ekström et al. (2012) for masses of 3 M⊙, 4 M⊙, 5 M⊙, 7 M⊙, 9 M⊙, 12 M⊙, 15 M⊙, 20 M⊙, 25 M⊙, 32 M⊙, and 40 M⊙. The solid lines indicate models without rotation, and the dashed lines with rotation. Also shown are previously measured sources as listed in the main text. In blue are the RSG stars, and in red the red giants.
Current usage metrics show cumulative count of Article Views (full-text article views including HTML views, PDF and ePub downloads, according to the available data) and Abstracts Views on Vision4Press platform.
Data correspond to usage on the plateform after 2015. The current usage metrics is available 48-96 hours after online publication and is updated daily on week days.
Initial download of the metrics may take a while.