Fig. 7
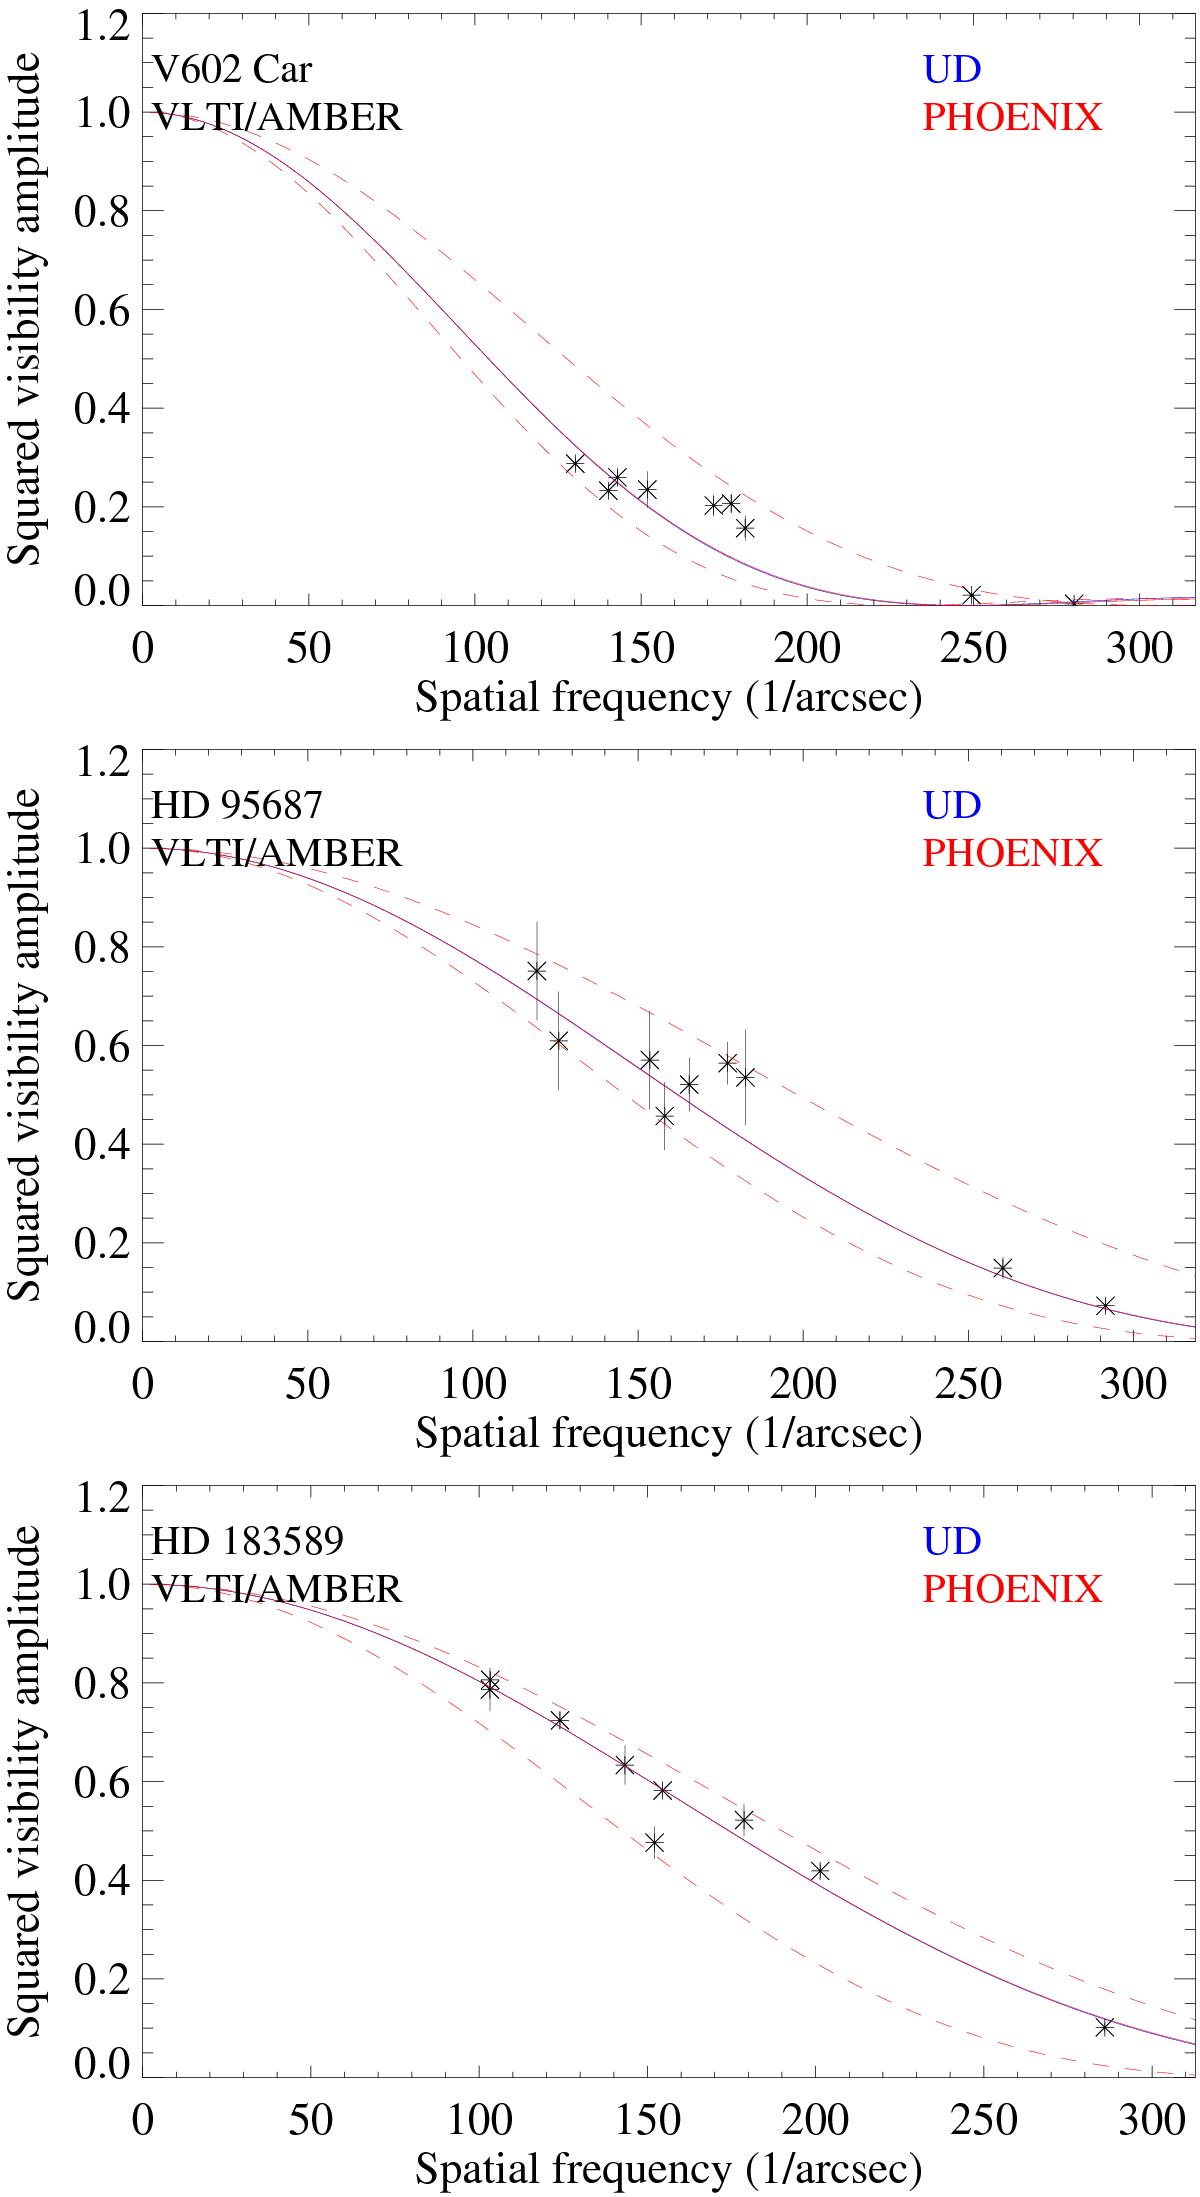
Squared visibility amplitudes in the continuum bandpass for V602 Car, HD 95687, and HD 183589 (from top to bottom) as a function of spatial frequency. Each point represents an average of data points within the continuum bandpass at 2.15–2.25 μm. Shown are data of all observing dates and both spectral setups. The red lines indicate the best-fit UD models and the blue lines (often indistinguishable from the red) the best-fit PHOENIX models. The dashed lines indicate the maximum and minimum visibility curves, from which we estimated the angular diameter errors.
Current usage metrics show cumulative count of Article Views (full-text article views including HTML views, PDF and ePub downloads, according to the available data) and Abstracts Views on Vision4Press platform.
Data correspond to usage on the plateform after 2015. The current usage metrics is available 48-96 hours after online publication and is updated daily on week days.
Initial download of the metrics may take a while.