Fig. 16
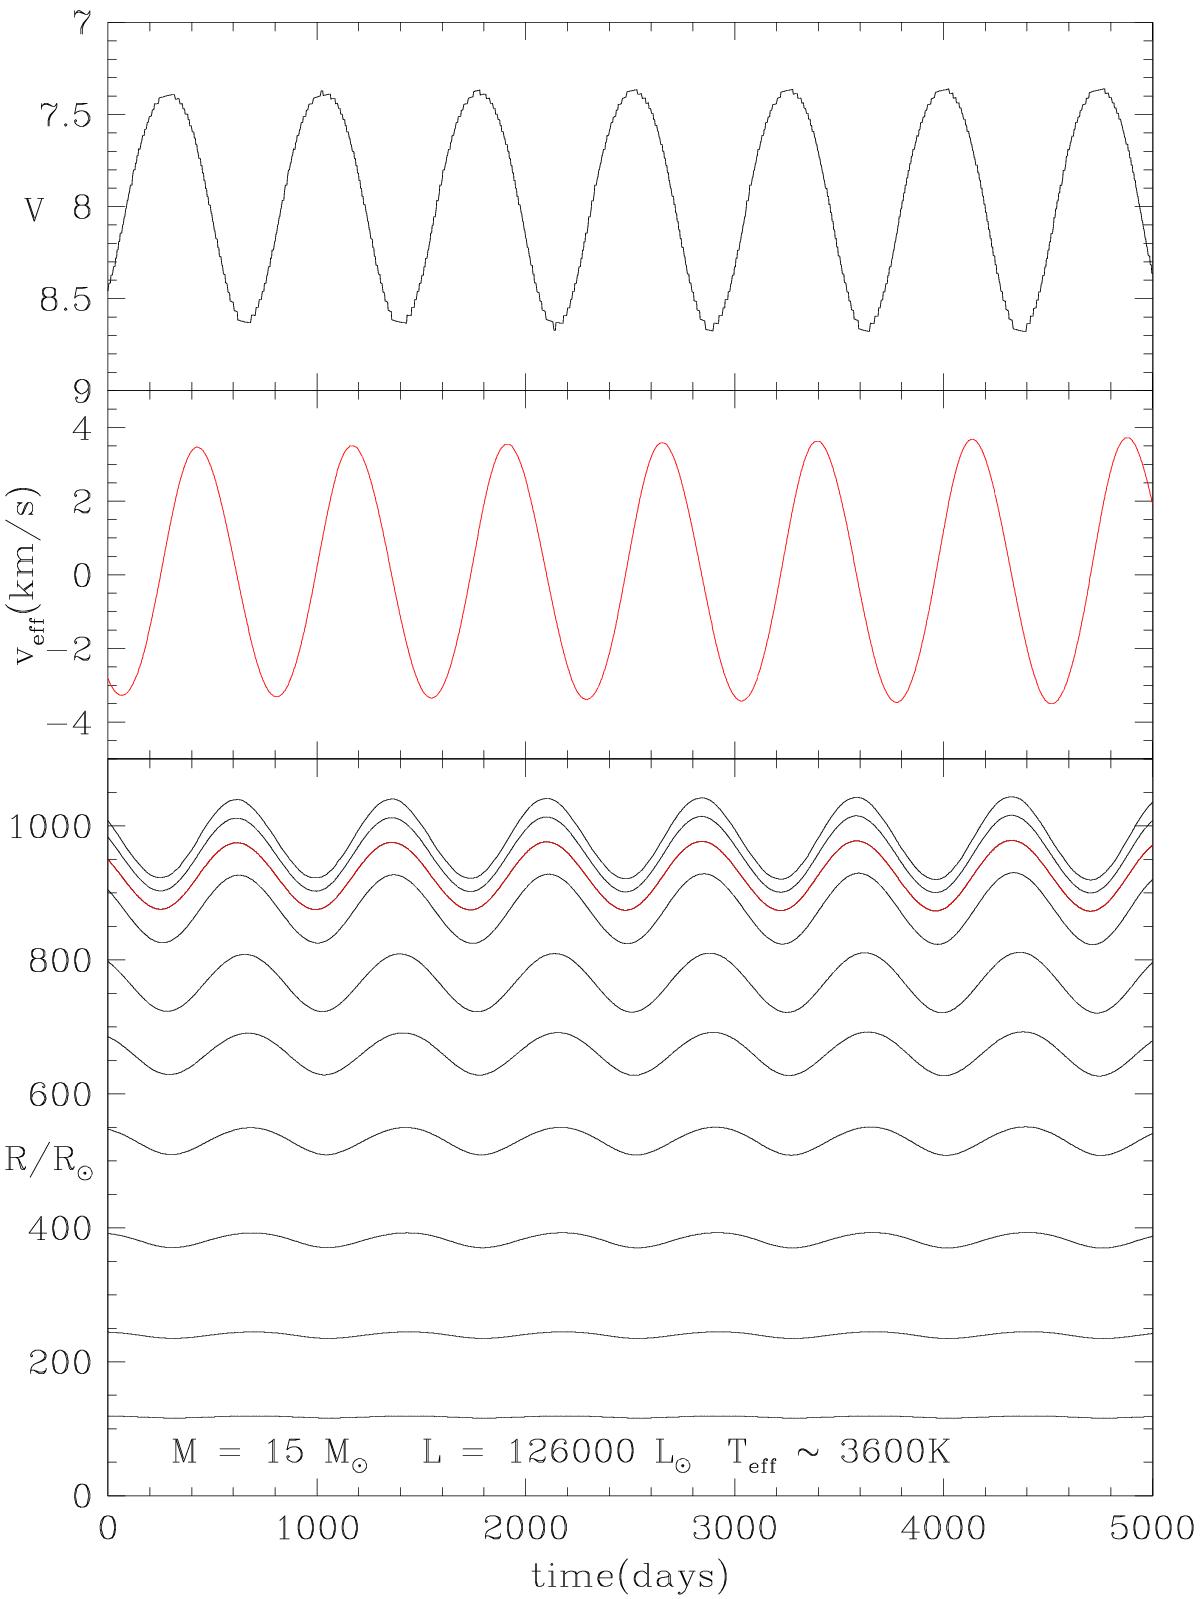
Pulsation model of a RSG with M = 15 M⊙, L = 126 000 L⊙, Teff ~ 3600 K. Bottom panel: radius variation of selected mass zones in a pulsating supergiant model with M = 15 M⊙ and L = 126 000 L⊙ (black curves). The red curve is the position of the photosphere (defined as the layer where the Rosseland optical depth equals 2/3). Middle panel: the velocity at the photosphere. Top panel: the visual light curve of the model, where the bolometric correction is obtained from the tables in Houdashelt et al. (2000a,b).
Current usage metrics show cumulative count of Article Views (full-text article views including HTML views, PDF and ePub downloads, according to the available data) and Abstracts Views on Vision4Press platform.
Data correspond to usage on the plateform after 2015. The current usage metrics is available 48-96 hours after online publication and is updated daily on week days.
Initial download of the metrics may take a while.