Fig. 3
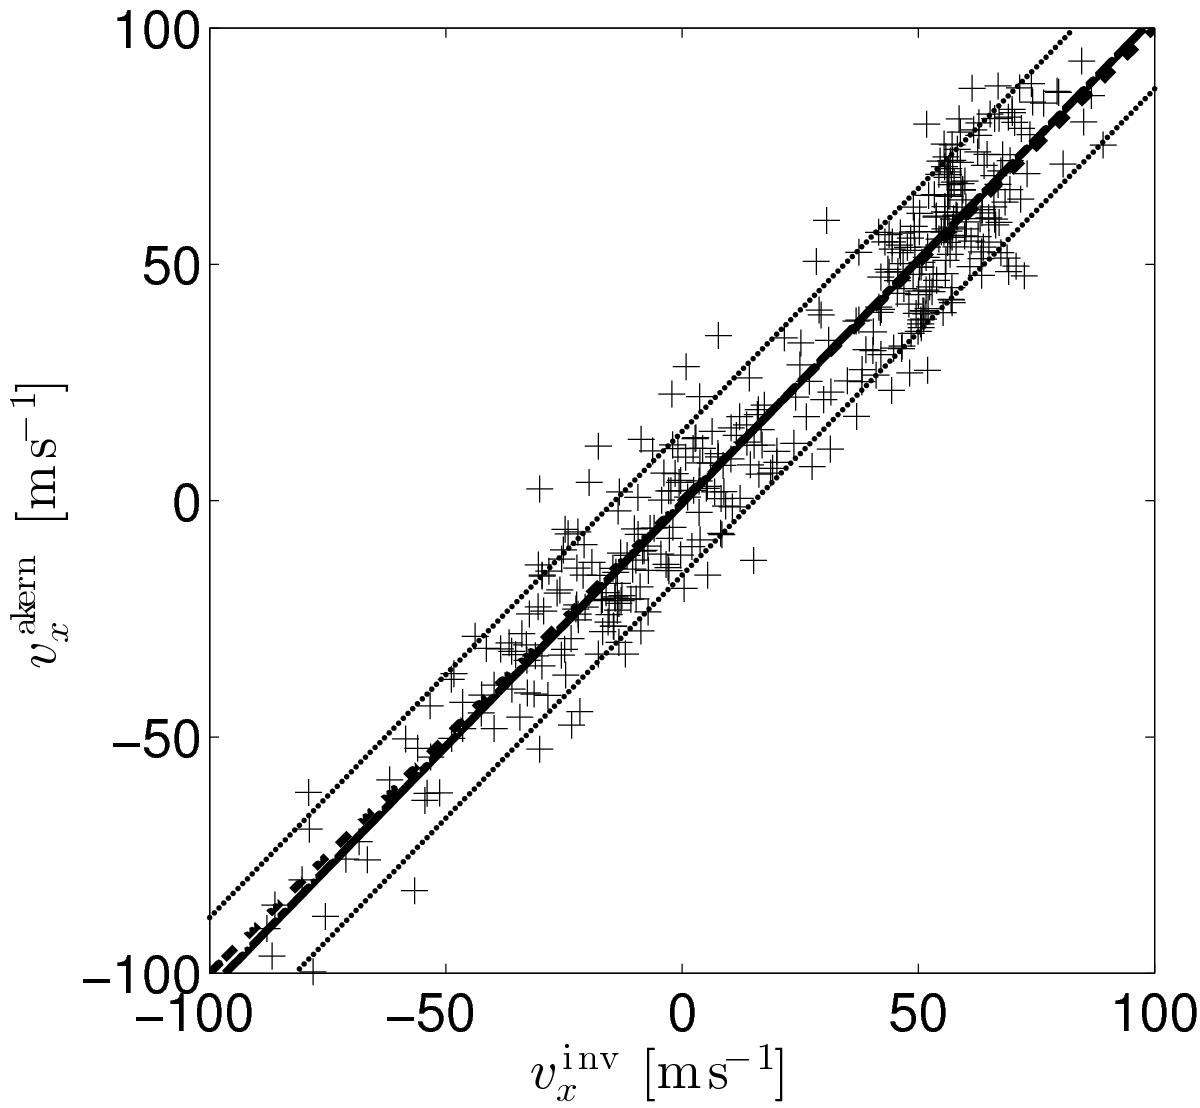
A direct comparison of the expected horizontal flow values to the inverted ones on a pixel-to-pixel basis (only every tenth pixel is plotted to make the plot simpler). The solid line represents the linear fit to the crosses, the thin dotted lines the intervals of the predicted random-noise (1σ interval), and the thick dashed line is the line with the unity slope.
Current usage metrics show cumulative count of Article Views (full-text article views including HTML views, PDF and ePub downloads, according to the available data) and Abstracts Views on Vision4Press platform.
Data correspond to usage on the plateform after 2015. The current usage metrics is available 48-96 hours after online publication and is updated daily on week days.
Initial download of the metrics may take a while.