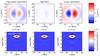
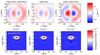
Fig. 1

Inversions for the horizontal flows in an average supergranule at depths 1.9 and 2.9 Mm, together with the display of the corresponding averaging kernels. The left column represents the inversion utilising combined ridge+phase-speed filtering, the middle column is for the ridge filters only, and the right column for phase-speed filters only.
Current usage metrics show cumulative count of Article Views (full-text article views including HTML views, PDF and ePub downloads, according to the available data) and Abstracts Views on Vision4Press platform.
Data correspond to usage on the plateform after 2015. The current usage metrics is available 48-96 hours after online publication and is updated daily on week days.
Initial download of the metrics may take a while.