Free Access
Fig. 10
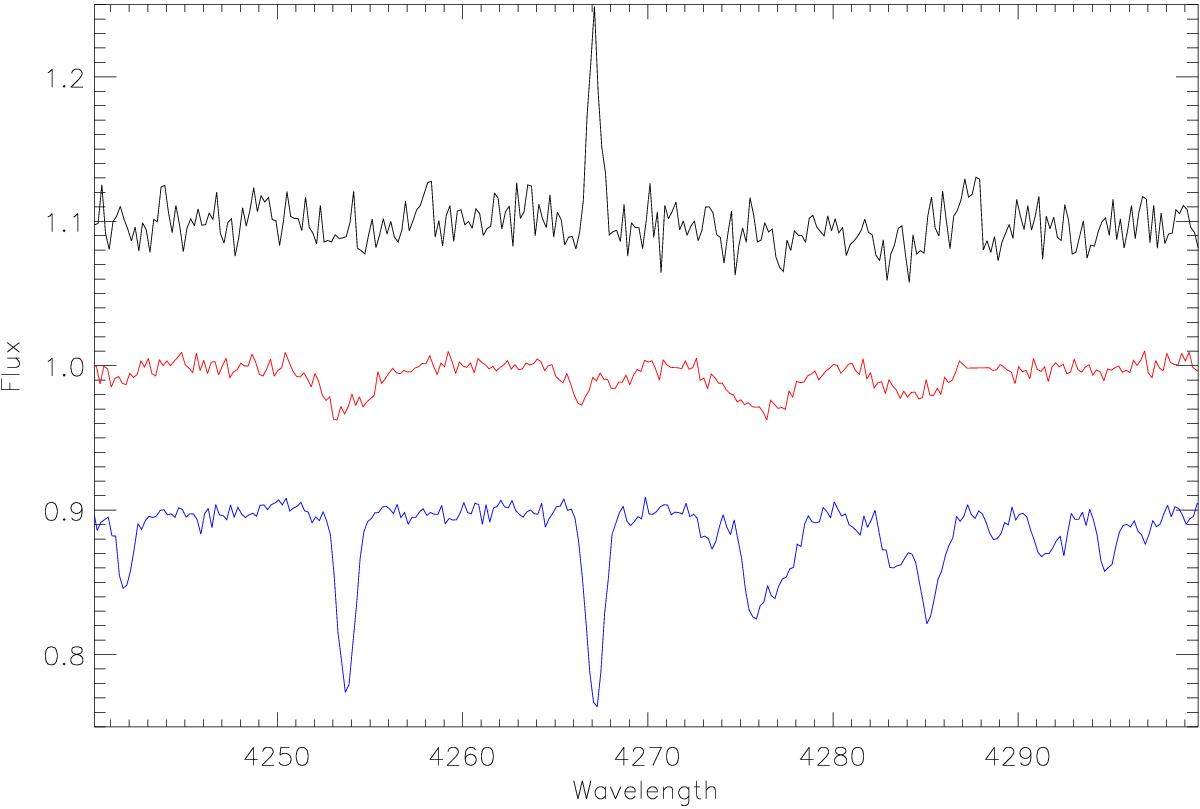
Normalised sample spectra encompassing the close C ii doublet at 4267 Å. The upper two plots are for the rapidly-rotating near main-sequence stars, VFTS 535 and 453. The lowest plot is for the supergiant, VFTS 315. The spectra have been shifted in the y-direction for clarity.
Current usage metrics show cumulative count of Article Views (full-text article views including HTML views, PDF and ePub downloads, according to the available data) and Abstracts Views on Vision4Press platform.
Data correspond to usage on the plateform after 2015. The current usage metrics is available 48-96 hours after online publication and is updated daily on week days.
Initial download of the metrics may take a while.